The thermal efficiency of open cycle constant pressure gas turbine can be improved by the following methods:
- Regeneration
- Intercooling
- Reheating
- Combination of above
1 Regeneration
In this method, the heat of the exhaust gases is used to heat the air coming out from the compressor, thus reducing the mass of fuel supplied in the combustion chamber. A schematic diagram of such a plant is shown in Fig. 16.9 (a).
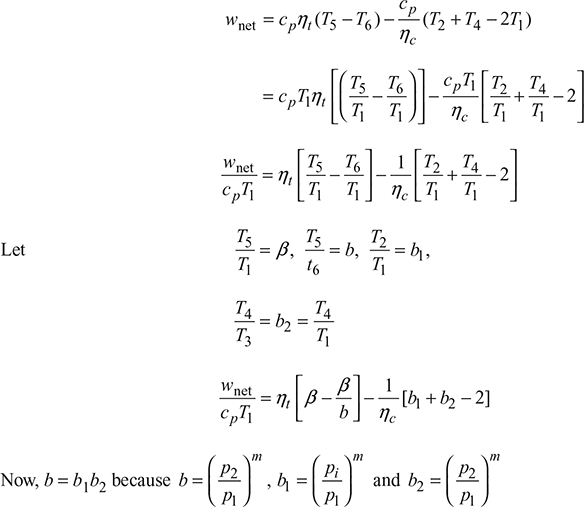
- Without Machine EfficienciesThe T-s diagram without machine efficiencies is shown in Fig. 16.9 (b).For 1 kg of airCompressor work, wc = w1 − 2 = cp (T2 − T1)Heat supplied, qs = q5 − 3 = cp (T3 − T5)Turbine work, wt =w3 − 4 =cp (T3 − T4)Net work, wnet = wt – wc = cp (T3 – T4) – cp (T2 – T1)
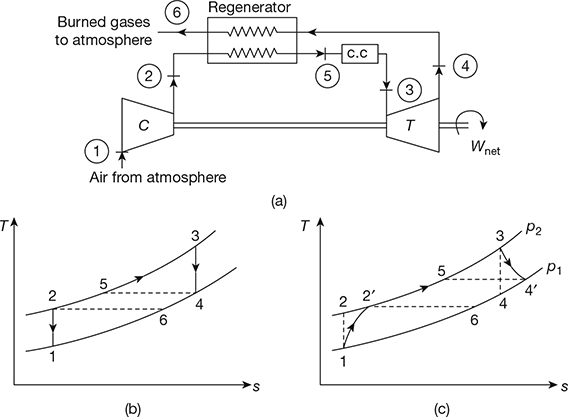 Figure 16.9 Open cycle gas turbine with regeneration: (a) Schematic diagram, (b) T-s diagram without machine efficiencies, (c) T-s diagram with machine efficienciesThermal efficiency,
 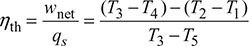 In an ideal regenerator, T4 = T5
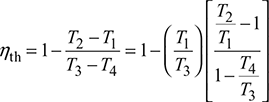
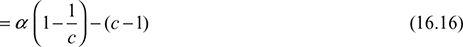
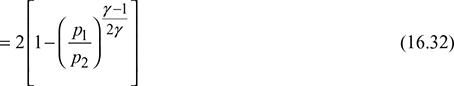
 Figure 16.10 Variation of thermal efficiency with pressure ratio for open cycle gas turbine with regenerationThe variation of thermal efficiency with pressure ratio is shown in Fig. 16.10. It may be seen that thermal efficiency increases with an increase in
  and decreases with increase in rp.
 - Considering Machine EfficienciesThe T-s diagram is shown in Fig. 16.9 (c).
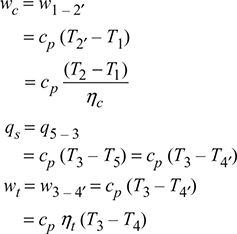
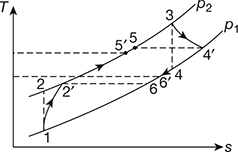 Figure 16.11 Actual regeneration process
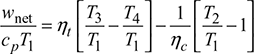
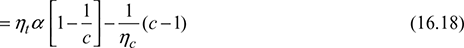
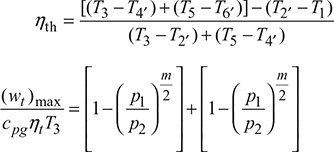
- Effectiveness of RegeneratorIn actual practice, the rise in temperature from T2′ to T5 = T4′ is not possible. The actual temperature of air will be T5′ < T5. Hence, actual thermal efficiency [see Fig. (16.11)] of the cycle becomes,
 The effectiveness of the regeneration is given by
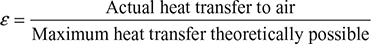
 where ṁa, ṁg = mass rate of flow of air and exhaust gases, respectivelycpa, cpg = specific heats of air and exhaust gases, respectively.
2 Intercooling
The work consumed by the compressor can be reduced by compressing the air in two stages and incorporating the intercooler in between, as shown in Fig. 16.12 (a). The corresponding T-s diagram is shown in Fig. 16.12 (b).
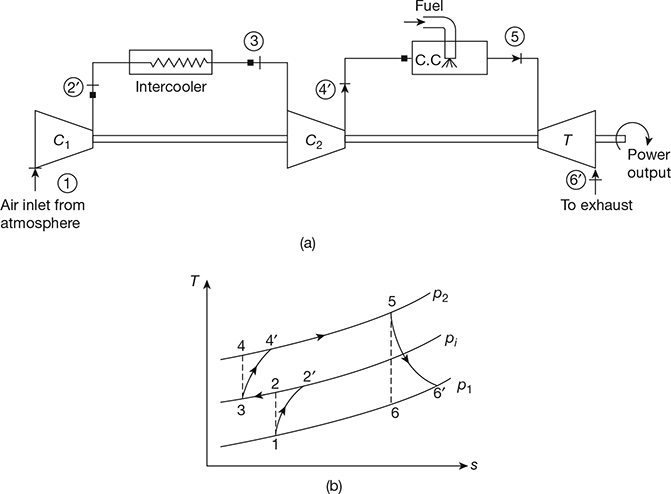
Figure 16.12 Gas turbine plant with intercooling: (a) Schematic diagram, (b) T-s diagram
For perfect cooling, T3 = T1 and if nc1 = nc2 = nc′ then

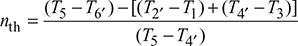

wnet = wt – wc = cp (T5 – T6′) – [cp (T2′ – T1) + cp (T4′ – T3)]
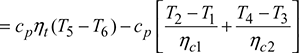
For perfect intercooling,T3 = T1 and if hc1 = ηc2 = ηc, then


3 Reheating
A considerable increase in power output can be achieved by expanding the gases in two stages with a reheat combustion chamber between the two as shown in Fig. 16.13 (a). The corresponding T-s diagram is shown in Fig. 16.13 (b).
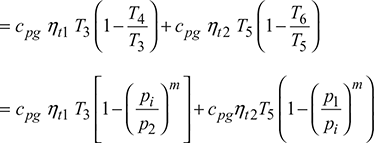
wt = cpg (T3 – T4′) + cpg (T5 – T6′)
= cpg ηt1 (T3 – T4) + cpg ηt2 (T5 – T6)
where ![]()
Let ![]()

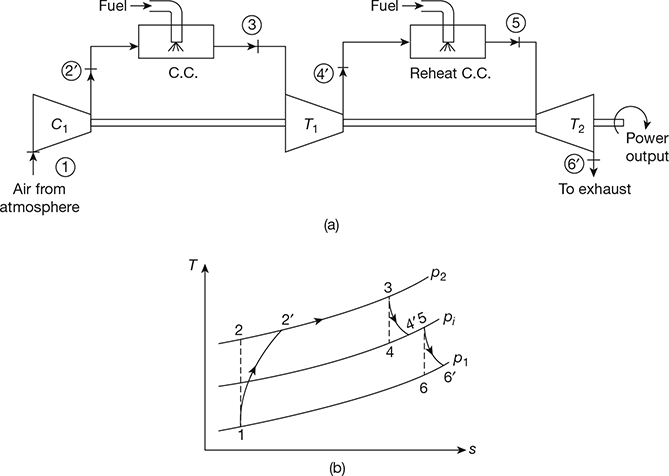
Figure 16.13 Gas turbine plant with reheating: (a) Schematic diagram, (b) T-s diagram
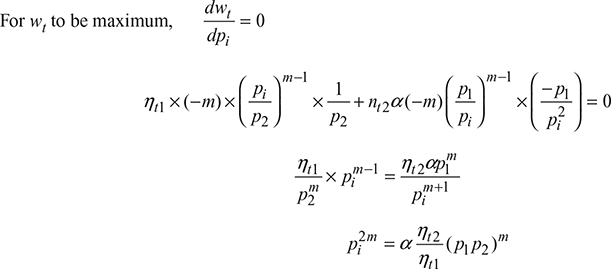
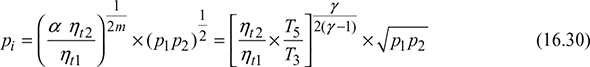
If ηt1 = ηt2 = ηt and T5 = T3, then

4 Reheat and Regenerative Cycle
This cycle is shown in Fig. 16.14.
wc = cp (T2 – T1)
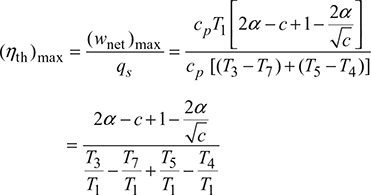
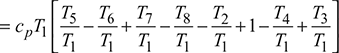
qs = q7 – 3 + q4 – 5 = cp (T3 – T7) + cp (T5 – T4)
wt = w3 – 4 + w5 – 6 = cp (T3 – T4) + cp (T5 – T6)
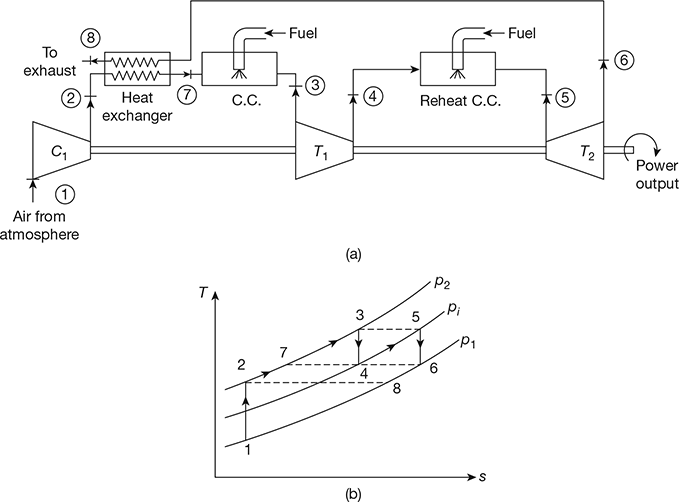
Figure 16.14 Gas turbine plant with reheat and regeneration: (a) Schematic diagram, (b) T-s diagram
= cp [(T3 – T4) + (T5 – T6) – (T2 – T1)]
Let ![]() so that rp = r1r2
so that rp = r1r2
So that c = c1c2
Now, ![]()
Now, T7 = T4 and T5 = T3

5 Cycle with Intercooling and Regeneration
The schematic arrangement and T-s diagram of the cycle are shown in Fig. 16.15.
wc = w1 – 2 + w3 – 4 = cp [(T2 – T1) + (T4 – T3)]
qs = q7 – 5 = cp (T5 – T7)
wt = w5 – 6 = cp (T5 – T6)
wnet=wt – wc = cp [(T5 – T6) – (T2 – T1) – (T4 – T3)]
Let ![]() so that c = c1c2 and T3 = T1
so that c = c1c2 and T3 = T1
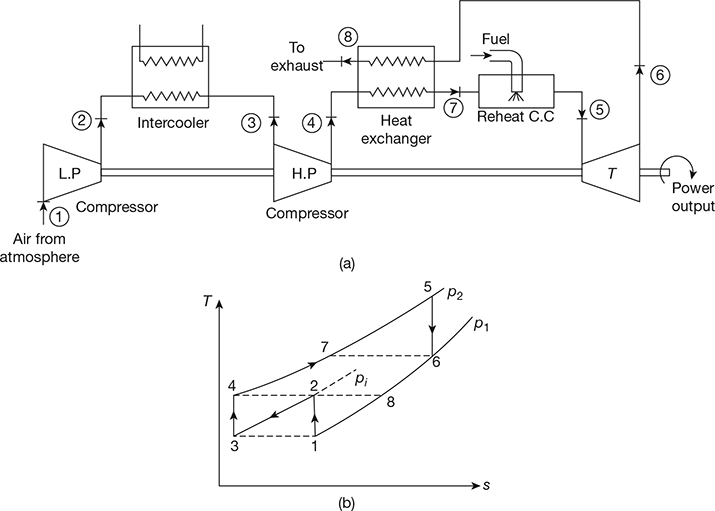
Figure 16.15 Gas turbine plant with inter cooler and regeneration: (a) Schematic diagram, (b) T-s diagram

Now, qs = cp (T5 – T7)

6 Cycle with Intercooling and Reheating
The schematic arrangement of this cycle is shown in Fig. 16.16 (a) and the corresponding T-s diagram in Fig. 16.16 (b).
wc = cp [(T2 – T1) + (T4 – T3)]
qs = cp [(T5 – T4) + (T7 – T6)]
wt = cp [(T5 – T6) + (T7 – T8)]
wnet = wt – wc = cp [(T5 – T6) + (T7 – T8) – (T2 – T1) – (T4 − T3)]
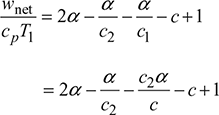
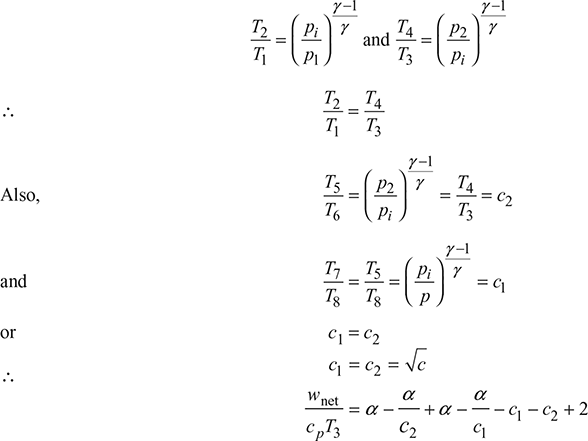
Now, T3 = T1 and T7 = T5 for perfect intercooling and reheating, respectively. Then,
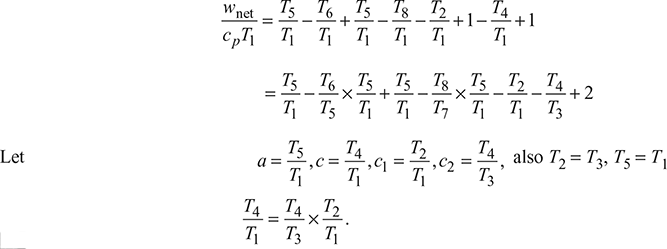
Thus, c = c1c2
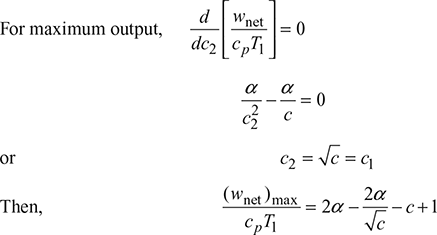
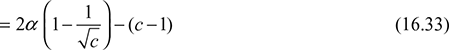
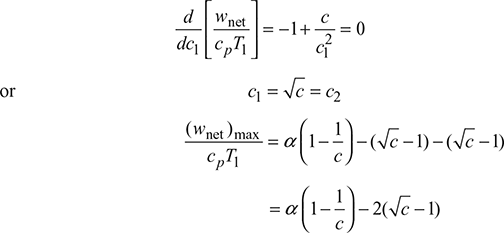
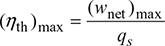
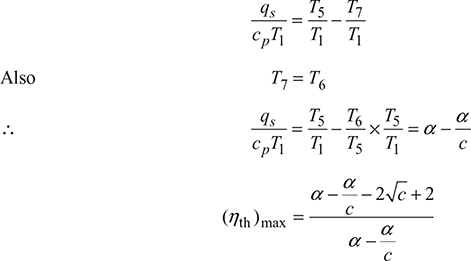
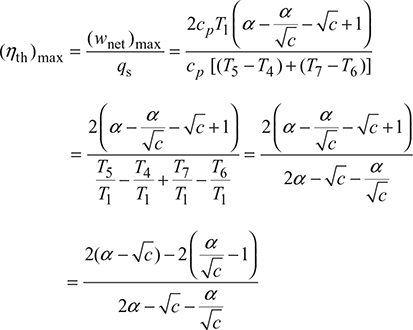
For maximum work output, ![]()
or ![]()
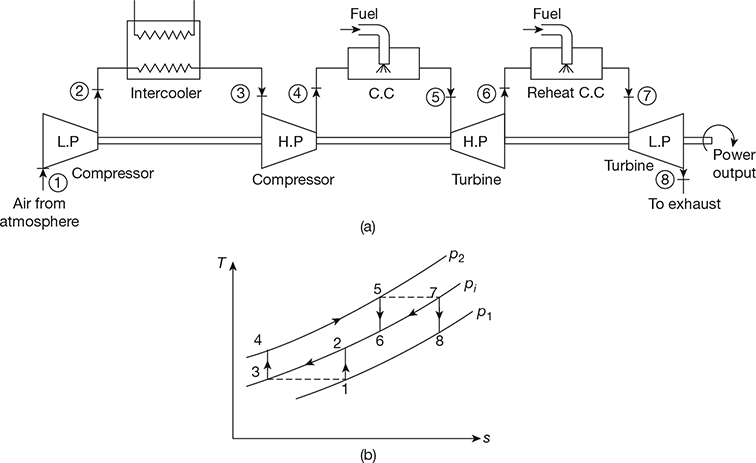
Figure 16.16 Gas turbine cycle with intercooler and reheating: (a) Schematic diagram, (b) T-s diagram

7 Cycle with Intercooling, Regeneration and Reheating
The schematic arrangement of the cycle and corresponding T-s diagram are shown Fig. 16.17.
wc = cp [(T2 − T1) + (T4 − T3)]
qs = cp [(T5 − T9) + (T7 − T6)]
wt = cp [(T5 − T6) + (T7 − T8)]
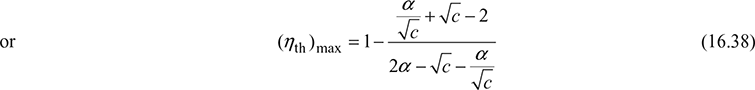
wnet = wt − wc = cp [(T5 − T6 + T7 − T8) − (T2 − T1 + T4 − T3)]
T7 = T5
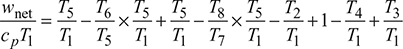
Let ![]() T1=T3 and T5=T7 so that c1=c2
T1=T3 and T5=T7 so that c1=c2
Leave a Reply