Many of the elements which make up a typical ventilation system are capable of providing some degree of sound attenuation. It is, therefore, very important to be able to estimate this attenuation in order to ensure acceptable acoustical conditions in all the areas to be served by the ventilation unit. This implies that there should be neither too little attenuation, since an excessively noisy condition would result, nor too much attenuation, since this could result in extremely low background noise levels which might significantly affect privacy in the area [27].
The elements and physical phenomena which should be considered in evaluating the sound attenuation characteristics of a complete ventilation system are as follows:
- Fan plenum chamber(s)
- Ducts
- Specially constructed sound attenuator(s) (silencer(s))
- Openings of ducts into large spaces which cause end reflections
- Changes in duct cross‐sectional area
- Elbows and take‐offs.
The natural attenuation given by these elements may be substantially increased when necessary by relatively simple means.
13.7.1 Use of Fiberglass in Plenum Chambers, Mufflers, and HVAC Ducts
Fiberglass materials are commonly used in HVAC systems. Such materials provide the most convenient and cost‐effective way to control noise in such systems. In the 1990s there was concern that fiberglass fibers may be carcinogen and that such materials used in ductwork may promote microbial growth. At that time the use of fiberglass in some institutional, educational, and medical establishments was severely limited or completely banned. However, in 1995 the International Agency for Research on Cancer (IARC) performed extensive research on carcinogenicity of fiberglass and found inadequate evidence to link its use to cancer in humans. Current evidence suggests that both moisture and dirt are required for microbial growth and care should be taken to remove both of these with filters and evaporator coils. The complete elimination of fiberglass duct liners in HVAC systems would require longer duct runs, larger fans and plenums, etc. which would result in much less satisfactory and more expensive systems.
13.7.2 Attenuation of Plenum Chambers
Plenum chambers are normally inserted into the HVAC system at the outlet section of a fan before the air distribution system of a building. They have two major purposes: (i) to smooth out the turbulent flow leaving the fan and (ii) to absorb some of the fan noise. Acoustically a plenum chamber may be simply defined as a large enclosed space containing sound‐absorbing material as shown schematically in Figure 13.44. In the design of plenum chambers, it is normal to assume that the typical dimension d, of the chamber is much greater than the acoustical wavelength, i.e. d >> λ, so that the sound field inside can be considered to have direct and reverberant components. This assumption, of course, fails at low frequency. There must be at least one inlet and one outlet in order that the flow and the acoustical path is continuous. Of the sound energy which enters the chamber, part will be radiated directly to the outlet and part will enter the outlet only after the successive reflections from the chamber walls. The remainder will be dissipated by any absorbing material present in the space.
Assuming the sound field in the chamber is reverberant, and that d >> λ, the amount of energy reaching the outlet by a direct path is directly proportional to the area of the outlet and falls off with the square of the distance between the inlet and outlet. It is also reduced by a directional effect if the outlet is not exactly opposite the inlet and will disappear altogether if the outlet and inlet are on the same plane. The amount of energy reaching the outlet from the reverberant field is also proportional to the outlet area and to the energy set up in the reverberant field within the chamber. This is dependent upon the total amount of acoustical absorption present in the space.
Acoustically lined plenum chambers are very frequently used in large air‐conditioning or ventilation systems where considerable attenuation is required to reduce the sound power produced by a fan. Although other methods of obtaining such attenuation are available from lined ductwork or commercial silencers, these are often expensive or insufficient on their own. Furthermore, unlike a plenum chamber, these are not capable of providing such high attenuation at low frequencies. A typical plenum chamber is shown diagrammatically in Figure 13.45 [31].
The attenuation of a plenum chamber is approximately given by:
(13.11)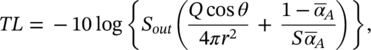
where (see Figure 13.45): Sout = area of plenum outlet, m2; S = total inside surface area of the plenum, m2; r = distance between centers of inlet and outlet of plenum, m; Q = directivity factor (assumed to be 4); ᾱA = average absorption coefficient of lining; θ = angle between vector r to long axis l of duct (see Eq. (13.13)).
The average absorption coefficient ᾱA of the plenum lining is given by
(13.12)![]()
where α1 = sound absorption coefficient of unlined inside surfaces of plenum; S1 = surface area of unlined inside surfaces of plenum, m2; α2 = sound absorption coefficient of lined inside surfaces of plenum; S2 = surface area of lined surfaces inside plenum, m2. If 100% of the inside surfaces of the plenum chamber are lined with a sound‐absorbing material, ᾱA = α2. Table 9.3 gives the values of sound absorption coefficients for selected common plenum materials.
The value for cos θ is obtained from
(13.13)
where (see Figure 13.45): ℓ = length of plenum, m; rv = vertical offset between axes of plenum inlet and outlet, m; rh = horizontal offset between axes of plenum inlet and outlet, m.
Equation (13.11) assumes the plenum behaves as if it were a large enclosure. Thus, Eq. (13.11) is valid only for the case where the wavelength of sound is small compared to the characteristic dimensions of the plenum. For frequencies less than the “cut‐on” frequency fco higher modes cannot exist and only plane wave propagation is possible in the duct. Then the results predicted by Eq. (13.11) are usually not valid. Plane wave propagation in a duct exists at frequencies below fco as follows:
(13.14)![]()
or
(13.15)![]()
where fco = cut‐on frequency, Hz; c = speed of sound in air, m/s; a = larger cross‐sectional dimension of rectangular duct, m; d = diameter of circular duct, m.
The cut‐on frequency fco is the frequency above which cross modes and spinning modes (in circular section ducts) can exist in addition to plane waves. At frequencies below fco, the actual attenuation normally is less than the values given by Eq. (13.11) by 5–10 dB. Eq. (13.11) usually applies best at frequencies of 1000 Hz and higher.
EXAMPLE 13.9
A small plenum chamber is 2.0 m high, 1.0 m wide, and 2.0 m long. The shape of the plenum is similar to that shown in Figure 13.45. The inlet and outlet are each 0.6 m wide by 0.5 m high. The horizontal distance between centers of the plenum inlet and outlet is 0.35 m. The vertical distance is 1.45 m. The plenum is lined with 25 mm thick 64 kg/m3 density fiberglass insulation board. The inside surfaces of the plenum are lined with the fiberglass insulation. Determine the transmission loss associated with this plenum. See Table 9.3 for the values of the absorption coefficients.
SOLUTION
The areas of the inlet section, outlet section, and plenum cross‐section are:
Sin = Sout = 0.6 × 0.5 = 0.3 m2, and Spl = 2.0 × 1.0 = 2.0 m2.
ℓ = 2.0 m, rv = 1.45 m, and rh = 0.35 m. The values of r and cos θ are
![]() m, and cos θ = 2.0/2.495 = 0.802. The total inside surface area of the plenum is S = 2 (2 × 1) + 2 (2 × 1) + 2 (2 × 2) = 16 m2. The total area of lined surfaces inside plenum is: 16 − 2(0.3) = 15.4 m2. The value of fco is:
m, and cos θ = 2.0/2.495 = 0.802. The total inside surface area of the plenum is S = 2 (2 × 1) + 2 (2 × 1) + 2 (2 × 2) = 16 m2. The total area of lined surfaces inside plenum is: 16 − 2(0.3) = 15.4 m2. The value of fco is:
fco = 343/(2 × 0.6) = 285 Hz.
The results using Eq. (13.11) are tabulated below in Table 13.10.
Table 13.10 Predicted attenuation in Example 13.9.
| One‐Octave Band Center Frequency, Hz | ||||||
|---|---|---|---|---|---|---|
| 125 | 250 | 500 | 1000 | 2000 | 4000 | |
| α | 0.07 | 0.23 | 0.48 | 0.83 | 0.88 | 0.80 |
| ᾱA | 0.10 | 0.26 | 0.50 | 0.84 | 0.88 | 0.81 |
| 1 − ᾱA | 0.90 | 0.74 | 0.50 | 0.16 | 0.12 | 0.19 |
| Sα—A | 1.62 | 3.99 | 7.69 | 12.88 | 13.62 | 12.44 |
| A = 103 cos ϴ/ π r2 | 41.0 | 41.0 | 41.0 | 41.0 | 41.0 | 41.0 |
| B = 103 (1 − ᾱA)/Sα—A | 554.2 | 185.9 | 65.1 | 12.7 | 8.5 | 15.5 |
| C = Sout(A + B) | 0.18 | 0.07 | 0.03 | 0.02 | 0.01 | 0.02 |
| TL, dB | 7.5 | 11.7 | 15.0 | 17.9 | 18.3 | 17.7 |
As discussed before, the predicted attenuation values (TL) for 125 and 250 Hz may be too large, since these frequencies are less than the cut‐on frequency, fco of 285 Hz. The ASHRAE Handbook [20] gives a somewhat complicated empirical method to give better low frequency attenuation predictions below fco.
At high frequencies, the above equation may yield values for the plenum attenuation which are sufficiently close to measured values for purposes of chamber design. However, at low frequencies, where the wavelength approaches or exceeds any of the chamber dimensions, the attenuation calculated from the above equation may be 5–10 dB less than that actually obtained with such a plenum chamber. In order to obtain good low frequency attenuation, the following requirements should be met:
- The distance between the inlet and outlet should be made as large as possible.
- The exits should be positioned so as to be well out of the line of sight of the inlet.
- The acoustical lining on the plenum chamber walls should have good low‐frequency absorption properties. This means that the lining should be between 5 and 10 cm (2 and 4 in.) thick. However, one should check carefully to see whether the extra cost involved – for example, in doubling the lining thickness – is justified by the extra attenuation obtained.
The chamber lining has a dual function in that it provides both sound absorption and thermal insulation. Although a thickness of 1.25–5 cm (0.5–2 in.) is normally adequate for the thermal insulation, a greater thickness of material is usually required to give adequate low‐frequency sound absorption and, hence, plenum attenuation.
It is normal to include the necessary heating and cooling coils within or adjacent to the plenum chamber, and usually these coils do not produce any significant noise. However, their auxiliary equipment (such as pumps) can produce objectionable noise and vibration and should therefore be properly isolated. With large systems, it is usual to mount the fan on a separate vibration‐isolated inertia block which, in turn, is isolated from a floating floor on which the whole plenum chamber rests. In smaller installations, the fan may be mounted directly on isolators on the floating floor. See the previous discussion concerning Figures 13.31, 13.34, and 13.38.
Many variations of the simple plenum chamber have been proposed. These have usually resulted from placing two or three single plenum chambers in series. Each additional chamber usually gives an extra 10 dB attenuation at high frequencies but very little improvement at low frequencies. It is for this reason that most of the plenum chambers found in practical HVAC systems are of the single‐chamber type. Other variations include the placement of partial‐height solid barriers within the chamber to reduce the direct sound pressure level at the outlet. However, in high‐velocity systems, these can result in turbulence‐generated noise produced at the edges of the barriers, which tends to nullify the attenuation provided by the chamber.
Many examples related to plenum chambers are to be found in architectural acoustics. A common example is found when the space above a drop ceiling is used as a common volume for return airflow from several rooms causing cross talk. Another example, is when a corridor is used in this way to reduce “cross talk” between nearby rooms with open doors. Here the corridor provides both acoustic absorption and a break in the direct path of sound propagation between the two doors. Ceiling tiles and carpet in the corridor can reduce the cross talk between open doors of bedrooms in a hotel or offices in a building. Cross talk can also occur between rooms through the supply or return air ducts linking two adjacent rooms. See Figure 13.46. This can be reduced by lining the supply or the return air duct with sound‐absorbing materials.
13.7.3 Duct Attenuation
As acoustic energy is propagated through a duct, some of the energy is lost by transmission through the duct walls, and some is lost by internal vibration energy dissipation within the walls. Above the fundamental frequency of mechanical resonance of the duct walls, more acoustic energy is transmitted through the walls at low than at high frequencies; consequently, more sound attenuation is observed in unlined ducts at low than at high frequencies. See the broken line in Figure 13.47. However, if the duct walls are made very stiff, then they radiate much less low‐frequency sound. This is the case for circular ducts where the increased mechanical stiffness results in lower low‐frequency attenuation characteristics than for a corresponding rectangular duct (see Tables .)
Table 13.13 Sound attenuation dB/m of unlined sheet metal ducts at one‐octave band center frequencies.
Source: based on ASHRAE Ref. [20] and other sources.
| 63 Hz | 125 Hz | 250 Hz | > 250 Hz | |
|---|---|---|---|---|
| Rectangular Duct Sizes | ||||
| 150 × 150 mm | 0.98 | 0.66 | 0.33 | 0.33 |
| 305 × 305 mm | 1.15 | 0.66 | 0.33 | 0.20 |
| 610 × 610 mm | 0.82 | 0.66 | 0.33 | 0.10 |
| 1220 × 1220 mm | 0.49 | 0.33 | 0.23 | 0.07 |
| Round Duct Sizes | ||||
| ≤ 150 mm | 0.10 | 0.10 | 0.16 | 0.16 |
| 180–380 mm | 0.10 | 0.10 | 0.10 | 0.16 |
| 380–760 mm | 0.07 | 0.07 | 0.07 | 0.10 |
| 760–1500 mm | 0.03 | 0.03 | 0.03 | 0.07 |
Fry states that “when calculating the attenuation of rectangular ducts, it is necessary to take both sidewall duct dimensions into account.” The attenuation for each dimension should be calculated separately and then added. Fry also suggests that upper limits for the predicted attenuations should be set in the octave bands as follow: 40 dB at 63 Hz, 30 dB at 125 Hz, 35 dB at 250 Hz, 40 dB at 500 Hz and 45 dB at 1000 Hz. Thus, large rectangular ducts should be chosen when good low frequency attenuation properties are required. Conversely, when ductwork passes directly over critical acoustical areas, circular ducts should be chosen (in preference to rectangular) in order to reduce the radiated low‐frequency noise. This effect can be explained by the higher (breakout) transmission loss (TL) of circular ducts than rectangular ducts in the 63 and 125 Hz one‐octave bands (see Figure 13.48). Flat oval ducts have a greater breakout TL at these frequencies than rectangular ducts, but a smaller TL than circular ones.
EXAMPLE 13.10
Determine the attenuation of a 610 mm × 610 mm cross‐section of unlined duct of length 10 m. Use all available methods of prediction including Table 13.11, Figure 13.47 and Table 13.13.
SOLUTION
Note that values given in the tables are dB/m, while in Figure 13.47, they are attenuation, dB, for a 3 m long duct. The 10 m values will be assumed to be 10 times those given in the tables, while the 10 m values obtained from Figure 13.47 are assumed to be given by 10/3 = 3.33 times the values in the figure. The results of the calculations are given in Table 13.14.
Table 13.14 Predicted attenuation, dB, of a 610 mm × 610 mm unlined, 10 m long duct, in Example 13.10.
| Source | One-Octave Band Center Frequency, Hz | ||||||
|---|---|---|---|---|---|---|---|
| 63 | 125 | 250 | 500 | 1000 | 2000 | 4000 | |
| Table 13.11 | 8.2 | 6.6 | 3.3 | 1.6 | 1.6 | 1.6 | 1.6 |
| Figure 13.47 | 2.5 × 3.33 = 8.33 | 2.0 × 3.33 = 6.7 | 1.0 × 3.33 = 3.33 | 0.5 × 3.33 = 1.7 | 0.5 × 3.33 = 1.7 | 0.5 × 3.33 = 1.7 | 0.5 × 3.33 = 1.7 |
| Table 13.13 | 8.2 | 6.6 | 3.3 | 1.0 | 1.0 | 1.0 | 1.0 |
If the walls of a duct are partially or wholly internally lined with a sound‐absorbing material, a significant increase in the resulting attenuation is observed (Figures 13.47 and 13.49). This increase is caused by the absorption of sound upon successive reflections within the duct and also by the extra damping given to the walls. If the duct is also externally lagged (usually for thermal reasons), approximately twice the attenuation values shown in Figure 13.47 are obtained at 125 and 250 Hz. For large lengths of ductwork, it is not possible to obtain more than approximately 30 dB attenuation because of flanking energy transmitted along the walls of the duct.
EXAMPLE 13.11
Determine the attenuation of a 610 mm × 610 mm cross‐section internally lined duct of length 6 m. Use all available data for lining thickness of 25, 50, and 100 mm.
SOLUTION
Figure 13.49 gives attenuation for a 3 m long duct. We will convert attenuations given to dB/m and then to attenuation for 6 m. See the results in Table 13.15.
Table 13.15 Predicted attenuation in decibels of a 610 mm × 610 mm lined, 6 m long duct, in Example 13.11.
| Lining Thickness, mm | Source | One‐Octave Band Center Frequency, Hz | ||||||
|---|---|---|---|---|---|---|---|---|
| 63 | 125 | 250 | 500 | 1000 | 2000 | 4000 | ||
| 25 | Figure 13.49 | 2.5 × 2 = 5 | 2.5 × 2 = 5 | 5 × 2 = 10 | 14 × 2 = 28 | 28 × 2 = 56 | 22 × 2 = 44 | 18 × 2 = 36 |
| Table 17 ASHRAE [20] | 0.7 × 6 = 4.2 | 0.7 × 6 = 4.2 | 1.6 × 6 = 9.6 | 4.6 × 6 = 27.6 | 9.2 × 6 = 55.2 | 7.2 × 6 = 43.2 | 5.9 × 6 = 35.4 | |
| 50 | Figure 13.49 | 2.5 × 2 = 5 | 3.6 × 2 = 7 | 10 × 2 = 20 | 25 × 2 = 50 | 35 × 2 = 70 | 22 × 2 = 44 | 18 × 2 = 36 |
| Table 18 ASHRAE [20] | — | 1.0 × 6 = 6 | 3.0 × 6 = 18 | 8.2 × 6 = 49.2 | 11.5 × 6 = 69 | 7.2 × 6 = 43.2 | 5.9 × 6 = 35.4 | |
| 100 | Figure 13.49 | 5 × 2 = 10 | 7.5 × 2 = 15 | 15 × 2 = 30 | 25 × 2 = 50 | 35 × 2 = 70 | 22 × 2 = 44 | 18 × 2 = 36 |
EXAMPLE 13.12
Determine the attenuation of a 610 mm × 610 mm cross‐section externally lagged duct of length 10 m. Use all available data.
SOLUTION
Table 13.13 gives attenuation values in dB/m for unlined rectangular ducts. The values given will be doubled. Table 13.12 gives values for rectangular externally lagged ducts with side wall dimensions in the range 400–800 mm, which will be selected. The results of the calculations are given in Table 13.16.
Table 13.16 Calculated attenuation values in decibels for 10 m long duct in Example 13.12.
| Source | Duct Length | One‐Octave Band Center Frequency, Hz | ||||||
|---|---|---|---|---|---|---|---|---|
| 63 | 125 | 250 | 500 | 1000 | 2000 | 4000 | ||
| Table 13.13 | 1 m length | 0.82 × 2 = 1.64 | 0.66 × 2 = 1.32 | 0.33 × 2 = 0.66 | 0.1 × 2 = 0.2 | 0.2 | 0.2 | 0.2 |
| 10 m length | 16.4 | 13.2 | 6.6 | 2.0 | 2.0 | 2.0 | 2.0 | |
| Table 13.12 | 1 m length | 1.64 | 1.32 | 0.66 | 0.22 | 0.16 | 0.16 | 0.16 |
| 10 m length | 16.4 | 13.2 | 6.6 | 2.2 | 1.6 | 1.6 | 1.6 | |
13.7.4 Sound Attenuators (Silencers)
When the natural sound‐attenuation characteristics of a complete ventilation system are inadequate, some additional attenuation has to be introduced into the system. This is often accomplished by the installation of a specially constructed sound attenuator or silencer. Such a device may simply be a lined duct incorporating a splitter system as described above, designed to give the required additional attenuation. However, because air flows over the lining on the walls and splitters, there is a corresponding drop in static air pressure across the device. This pressure drop is dependent upon the airflow velocity and the percentage open area, as shown in Figure 13.50. More discussion concerning pressure drop in duct systems can be found in Ref. [32].
The following expression is useful for estimating the pressure drop ∆P across a typical splitter‐type attenuator
(13.16a)![]()
where ∆P = pressure drop in inches of water; V = air flow velocity, ft/min; and S = open area, ft2, or
(13.16b)![]()
where ∆P = pressure drop in pascals; V = air flow velocity, m/s; and S = open area, m2.
In mechanical systems where large static pressure drops cannot be tolerated, alternative silencer designs are utilized. These silencers are usually circular in cross‐section and contain not only acoustical lining on their inside walls but also a lined center body which provides additional sound attenuation and also streamlines the airflow through the unit. This reduces both the pressure drop across the silencer and the generation of noise by the flow of air through it.
The construction of common splitter cylinders is shown in Figure 13.51 including a cylindrical silencer. See also discussion in Chapter 10 concerning splitter silencers. The attenuation of a typical cylindrical silencer is shown in Figure 13.52. The attenuation usually decreases somewhat as the flow velocity is increased. Of more concern is the considerable increase in flow noise with increased flow velocity.
Care must be taken as to where to locate such silencers. Improper placement can result in severe degradation of performance so that noise paths bypass the silencer. See Figure 13.53. The best location for the silencer is in the wall of the mechanical room shown in Figure 13.53. A good location is for the silencer to be just inside the room. The two bottom locations give poor results, since noise can bypass the silencer in both cases.
The performance of silencers depends on their length, thickness of absorbing material and geometries. Figure 13.54 shows typical examples of available silencers with the lowest performance and best performance. Also shown is the attenuation of a 3 m long duct lined with 25 mm absorbing material. It is seen that as much as 30 dB attenuation can be obtained above 500 Hz, but below this frequency the attenuation is poor.
Figure 13.55 compares the attenuation achieved by typical 1.5 m long silencers. Coating the absorbing material with film protection and use of honeycomb spacers can reduce the effectiveness at low and medium frequencies, but increase this at high frequency. A typical reactive silencer can have a similar performance at low frequency but a poorer one at high frequency. See also Chapter 9.
13.7.5 Branches and Power Splits
Whenever a given volume of airflow is split up into two or more paths, there is an associated division of sound power between these paths. In such a case, the power loss is determined either from the ratio of the areas of the duct before and after the split or to the ratio of the air volume flow rates before and after the split. For example, if a duct with air having a volume flow rate Q1 and of cross‐sectional area A1 branches into several other ducts of which one has a cross‐sectional area A2 and flow rate Q2, then the power loss (i.e. attenuation) from the main duct to this branch is
(13.17)![]()
or
(13.18)![]()
This is equal to the ratio of the air volume flow rates before and after the division only for a constant velocity system. In such a system, the power split losses can be determined from the percentage of air reaching a given outlet grille. Equations (13.17) and (13.18) are strictly only valid for constant velocity systems. If the sum of the branch areas A2 is not equal to A1, then there is a reflection.
13.7.6 Attenuation Due to End Reflection
When a duct discharges air into a large acoustical space (i.e. a room or plenum chamber), there is a sudden change in both the cross‐sectional area and acoustic impedance. This results in some of the sound being reflected. Such a loss (attenuation) is known as an “end reflection” and can result in a significant quantity of low‐frequency attenuation being introduced into a system. Figure 13.56 shows some typical end reflection losses of a duct opening into a room. The end reflection is frequency‐dependent (see Figure 13.57). This effect plays an important role in the attenuation obtained at the entrance to a plenum chamber.
EXAMPLE 13.13
Determine the end reflection for 150 mm × 150 mm, 305 mm × 305 mm, and 610 mm × 610 mm ducts flush‐mounted with a wall. Use Figures 13.56 and 13.57.
SOLUTION
Use of the two figures gives slightly different results. The end reflection is seen to be greatest at low frequency where the acoustic wavelength is much greater than the duct sidewall dimension(s). The end reflection effect is also greater if the duct exit is located in free space or at wall‐floor or wall‐ceiling junctions. The reflection increases further at low frequency if the duct exit is located near to a room corner (see Table 3.2 in Chapter 3). Typical end reflections are shown in Table 13.17.
Table 13.17 End reflections, dB, obtained from Figures 13.56 and 13.57.
| Duct dimensions, mm | One-octave band center frequency, Hz | ||||||
|---|---|---|---|---|---|---|---|
| 63 Hz | 125 Hz | 250 Hz | 500 Hz | 1000 Hz | 2000 Hz | 4000 Hz | |
| 150 × 150 Figure 13.56 | 16 | 12 | 8 | 3 | 1 | 0 | 0 |
| 150 × 150 Figure 13.57 | 18 | 15 | 10 | 4 | 1 | 0 | 0 |
| 305 × 305 Figure 13.56 | 12 | 7 | 3 | 1 | 0 | 0 | 0 |
| 305 × 305 Figure 13.57 | 15 | 10 | 3 | 1 | 0 | 0 | 0 |
| 610 × 610 Figure 13.56 | 7 | 3 | 1 | 0 | 0 | 0 | 0 |
| 610 × 610 Figure 13.57 | 10 | 4 | 1 | 0 | 0 | 0 | 0 |
13.7.7 Attenuation by Mitre Bends
Whenever the airflow in a ventilation system is caused to change its direction, some attenuation is obtained because some of the incident sound is reflected hack toward the source. Noise is thus reflected and attenuated at mitre bends in ductwork, provided the duct cross dimensions are large compared to a wavelength. This attenuation can be further improved by adding a sound‐absorbing lining to the duct walls before and/or after the bend. See Figures 13.58 and 13.59.
The effect is also shown in Figure 13.60. Large radius bends or bends with large radius turning vanes provide very little attenuation. However, such bends do not produce any significant amounts of flow‐generated noise. This is discussed in the next section of the chapter. Tables 13.18 and 13.19 show that the useful high frequency attenuation achieved with mitre bends is significantly reduced if they are fitted with large turning vanes instead of vanes of small width. If turning vanes are used, they should have a width less than 1/8 of the wavelength of sound at which the greatest attenuation is needed. For frequencies of 1000 Hz and lower, the vanes should be no more than 50 mm wide [8].
Leave a Reply