Definition
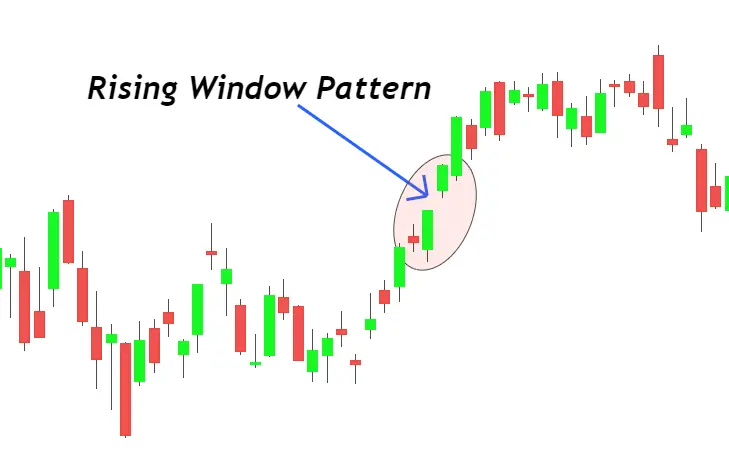
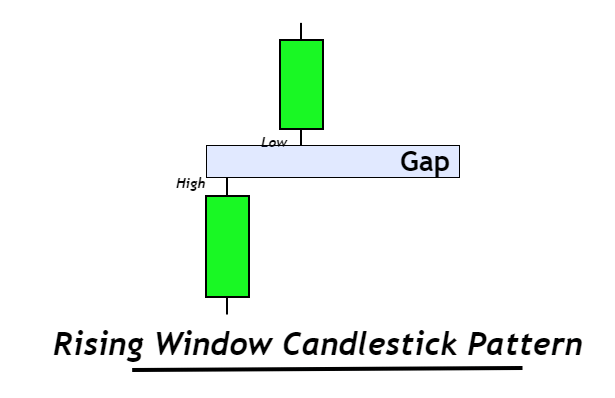
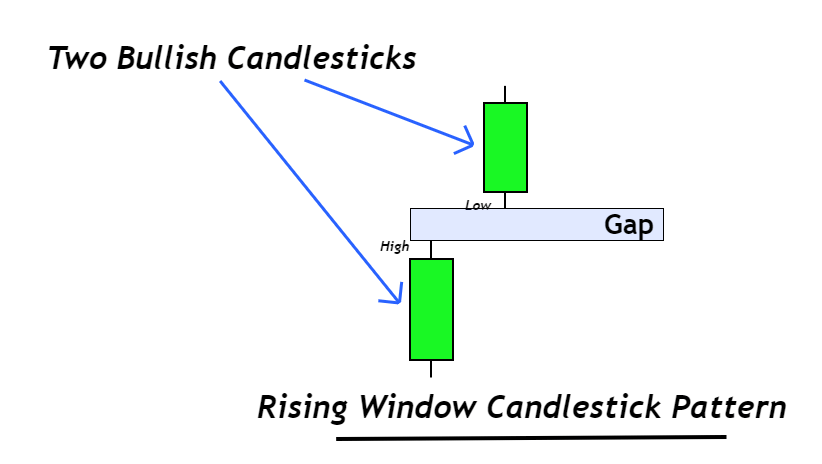
The rising window is a candlestick pattern that consists of two bullish candlesticks with a gap between them. The gap is a space between the high and low of two candlesticks. it occurs due to high trading volatility.
It is a trend continuation candlestick pattern and it is an indication of the strong strength of buyers in the market. When a rising window will form, then the price will continue to rise upward.
How to identify rising window pattern?
To find out a valid rising window candlestick pattern on the price chart, follow the following steps
- Look for a gap between two bullish candlesticks. It is a space between the low of recently made candlestick and high of previous candlestick
- The two bullish candlesticks should have large body representing a strong momentum of buyers
- It should form during a bullish price trend
Rising window candlestick usually works during an uptrend. Because it is a trend continuation signal. On the other side, if the rising window pattern forms below the resistance zone then there are chances of reversal. So you should avoid trading rising window candlestick patterns just below the resistance zone.

If it forms after the breakout of the resistance zone then a rising window pattern will work and it is a good trend continuation signal.
Rising Window Pattern: Information Table
| Features | Explanation |
|---|---|
| Number of Candlesticks | 2 |
| Prediction | Bullish trend continuation |
| Prior Trend | Bullish trend |
| Counter Pattern | Falling Window Pattern |
What does the rising window pattern tell traders?
Before trading the rising window pattern, you should obviously learn the reason for the formation of this candlestick pattern. You have understood that this is a bullish trend continuation pattern but you don’t know why does this pattern forms on the chart. What type of trading activity is going on behind the price chart?
To get the answer to these questions continue reading below
The body of bullish candlestick indicates the momentum and power of buyers in the market.
A large bullish body means more buyers are buying a specific asset. A small bullish body means few buyers are buying a specific asset. The market works like a tug of war.
When a candlestick closes then a new candlestick will open usually at the same level.
But sometimes when a large number of orders get filled then a sudden change in price happens. This sudden change causes a gap in the price chart. This large amount of buy orders is a direct indication of an upcoming bullish trend because institutional traders are interested to buy that specific asset.
Leave a Reply