How does the Rickshaw Man candlestick pattern form?
As we have discussed earlier that security’s price is controlled by both bears and bulls at different times but during the same period. This disparity creates a very long leg of the Rickshaw Man pattern. The opening and closing prices remain almost at the same level forming a Doji.
How to identify a Rickshaw Man candlestick pattern?
It is not that easy to identify the Rickshaw Man pattern because the price trend leading to the pattern is not mandatory. You should look for a single candle line with a small Doji-like body and long wicks at either side of the body. The body of the candle is near the midpoint of the candlestick. You should also look for opening and closing prices that are within the pennies of each other.
What does the pattern tell traders?
The behavior of the Rickshaw Man pattern amounts to indecision. It behaves just like the Doji patterns that show the indecision and state of equilibrium in the market. Similar opening and closing prices illustrate the reason behind the inability of traders to take decisions. When expert traders see the Rickshaw Man pattern, they cannot decide their move. They are compelled to sit on the side-line and wait.
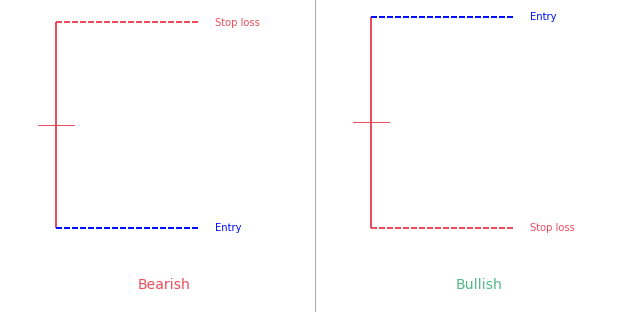
How to trade a Rickshaw Man candlestick pattern?
Technical analysts and experts suggest that the Rickshaw Man candlestick pattern must be used with other technical indicators, chart patterns, or price action analysts to observe a changing trend or continuation. They do not consider this pattern reliable to be used in isolation. Let us try to understand the trading of a Rickshaw Man pattern. For example, during a current uptrend, the prices begin to fall. In this scenario, the Rickshaw Man pattern in conjunction with an oversold stochastic signal that the low of the downtrend is near. When the prices begin to move up, the Rickshaw Man pattern and signals of other indicators are confirmed.
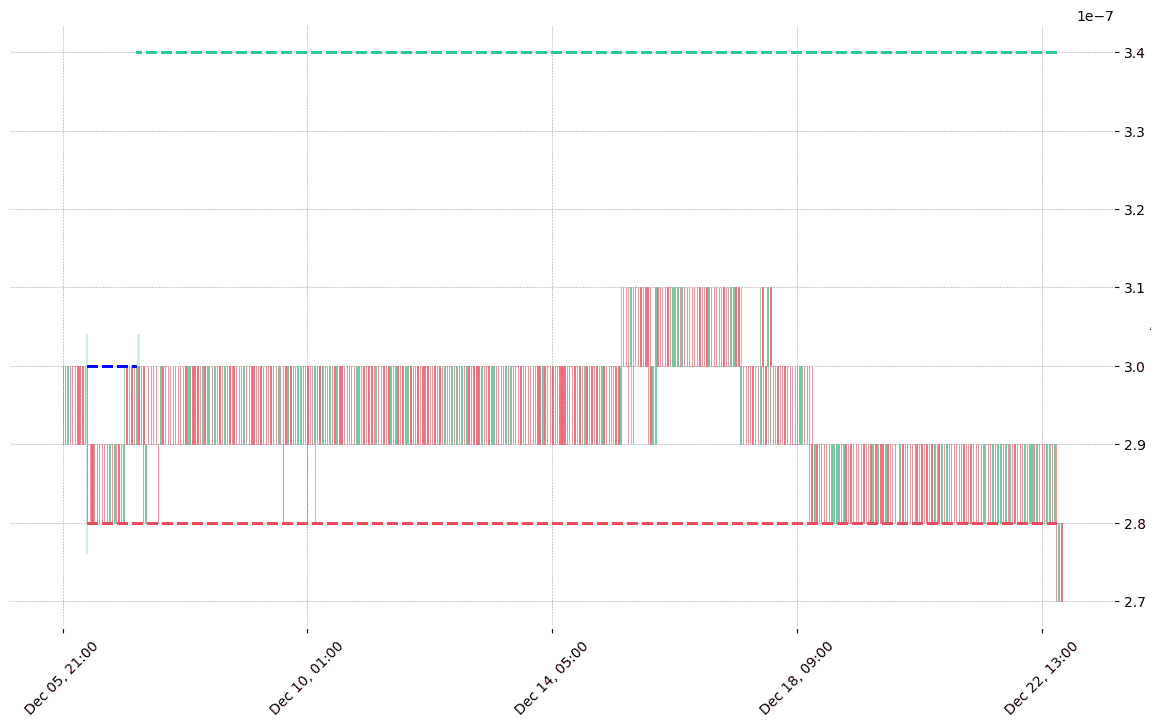
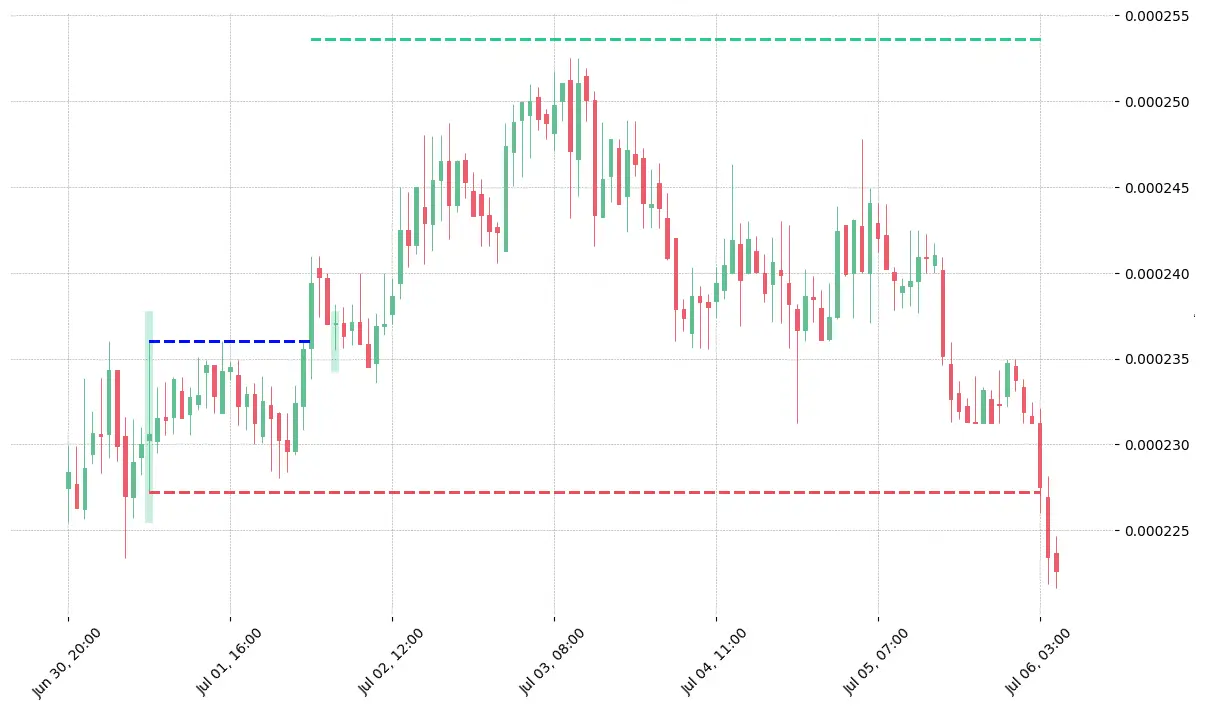
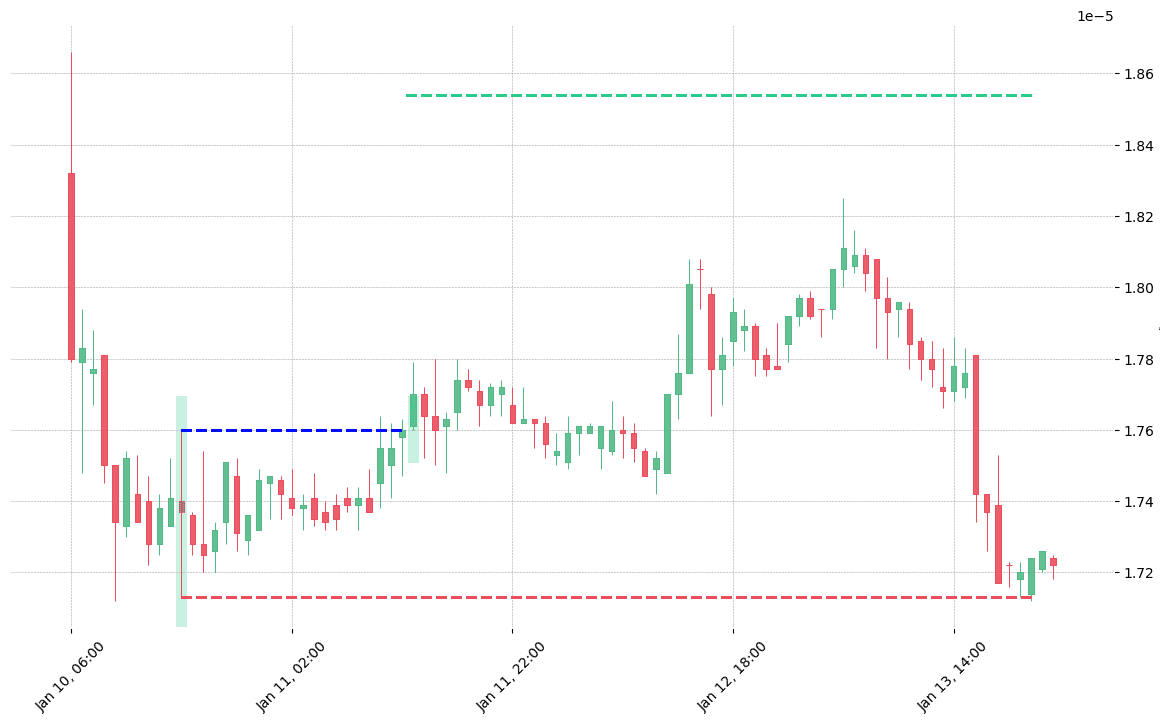
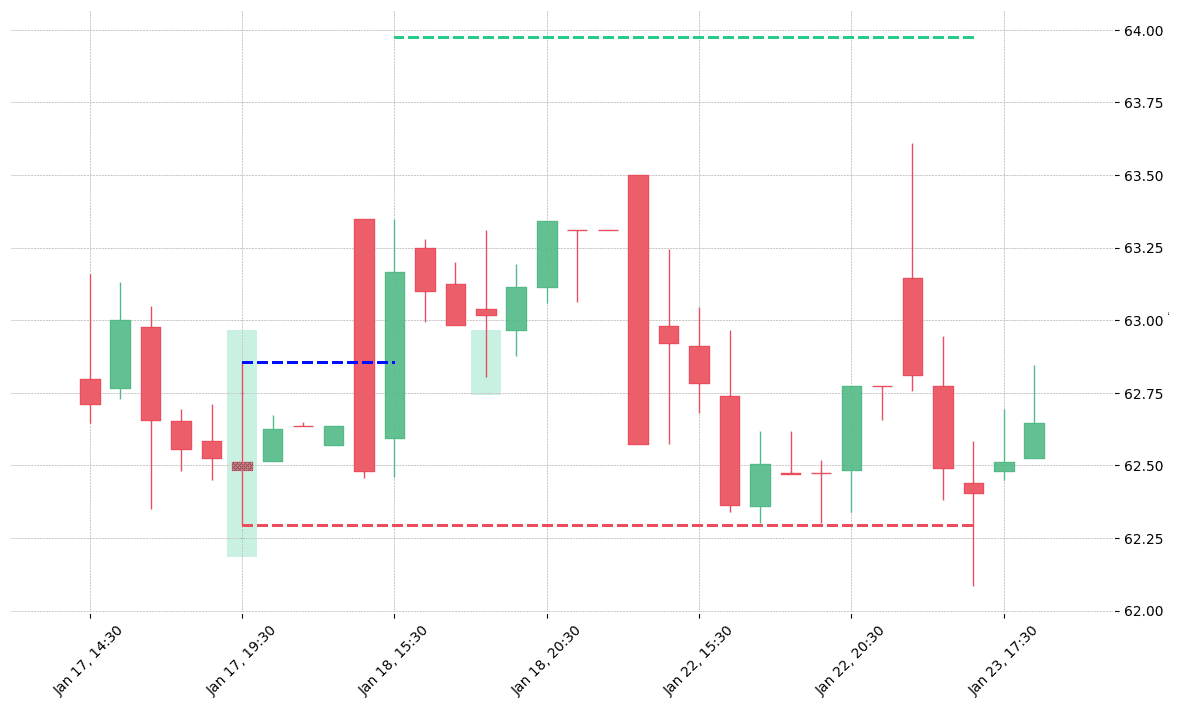
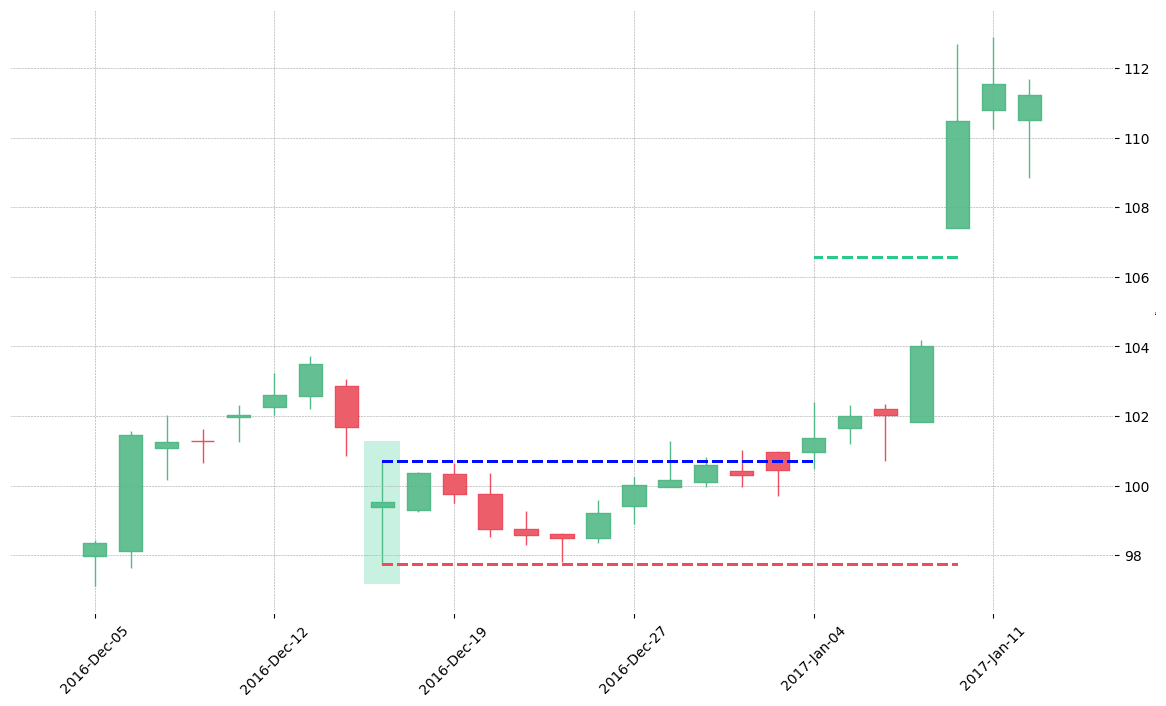
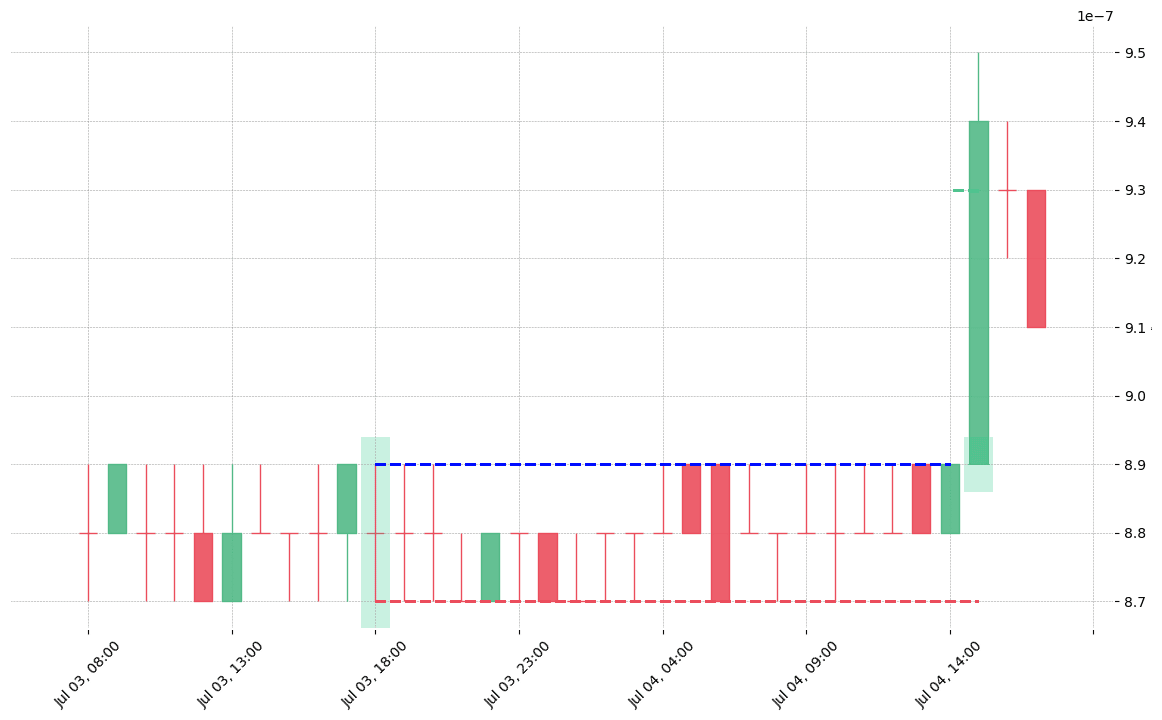
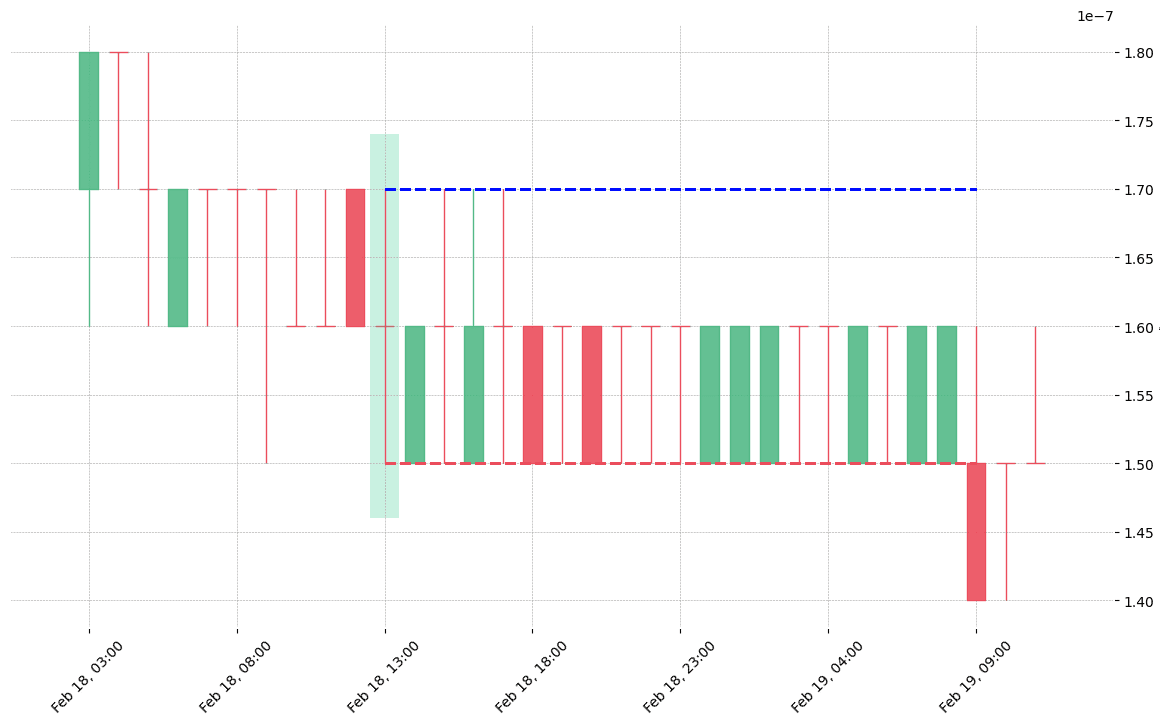
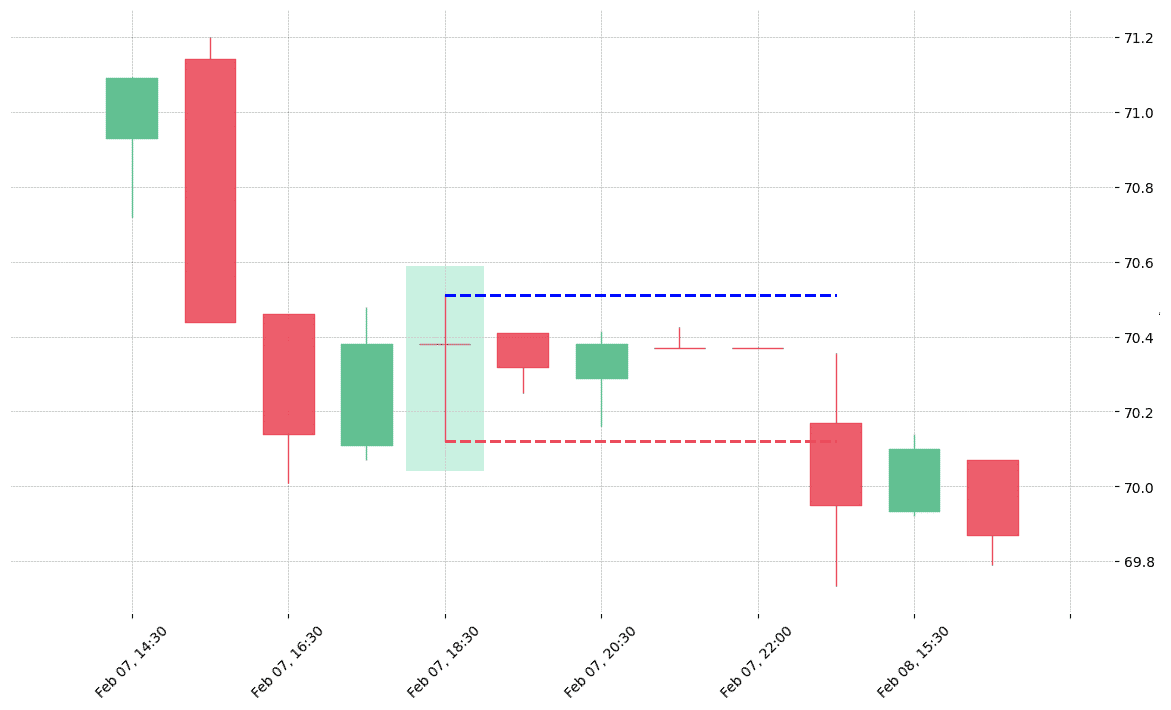
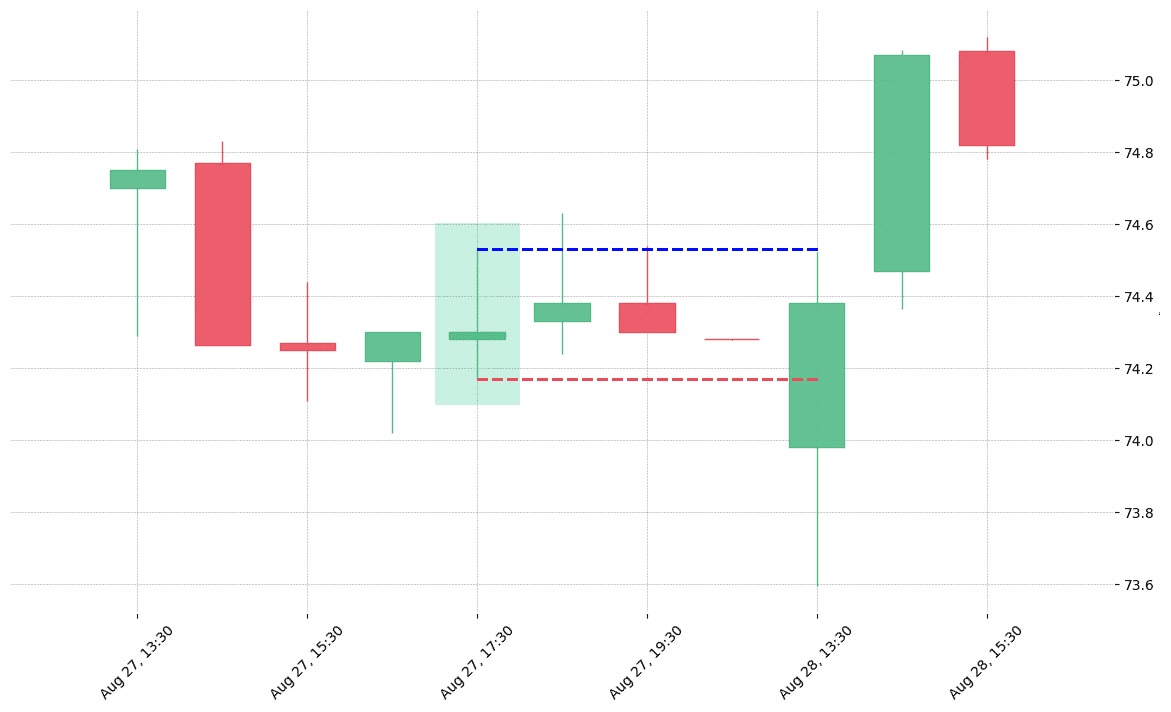
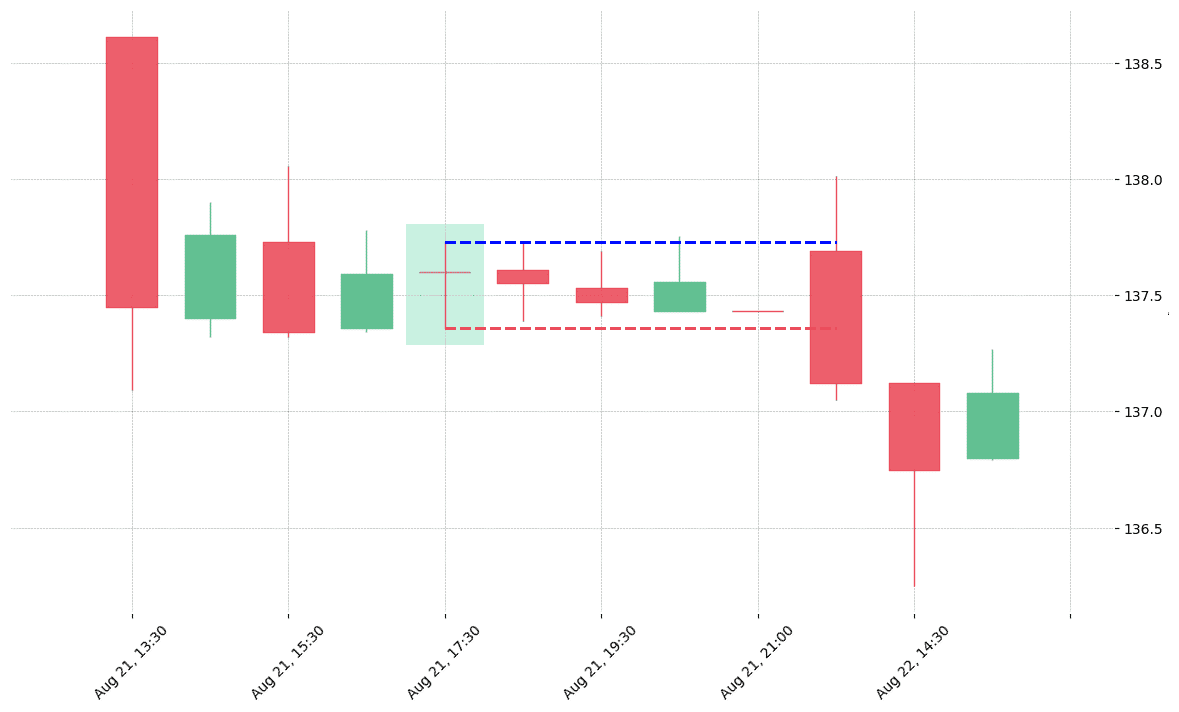
Rickshaw Man pattern look in real life
Leave a Reply