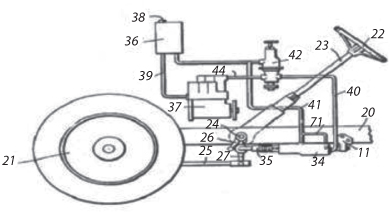
The basic aim of power steering is to minimize human steering effort and this is achieved by a closed loop hydraulic assisted rack and pinion type steering system. The other aim is to design the rack and pinion gears to smooth out steering by using a helical gear and light weight components so that the steering system provides control over direction of travel, good maneuverability, smooth recovery from turns and minimum transmission of road shocks.
Hydraulic Power Assisted Steering – HPAS System
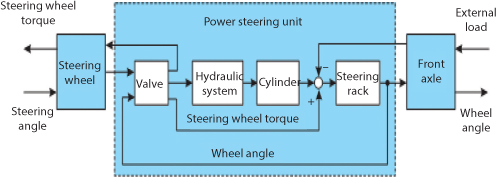
HPAS system is one of the most widely used steering systems owing to its enhanced sensitivity and smooth operation. The method of utilizing oil under high pressure to boost the servo is advantageous in terms of weight and cost reduction. With closed loop operation shown in Figure 6.5, the inputs like steering wheel angle and torque will be transferred to hydraulic power steering unit which houses valve, steering and hydraulic system which magnifies the turning effect of the respective axles.
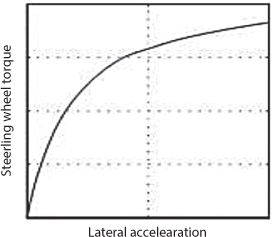
Static Characteristic of the Hydraulic Power Steering System
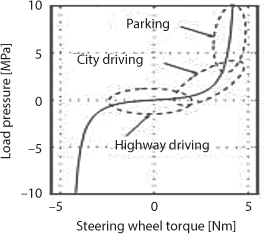
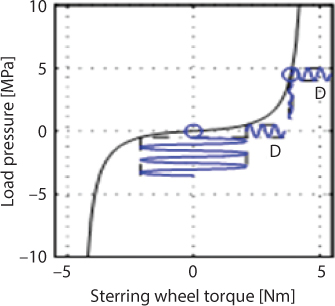
Design of a HPAS system has to take into account trade-off between road feel and assistance under different driving conditions. This relationship is given in Figure 6.6. Figure 6.7, shows the relationship between wheel torque and load pressure. Figure 6.8, depicts the relationship between assisting and manual forces as a factor of the total generated force (Equation 6.1). From the figure, it is evident that at low torque, the manual force is high to ensure good road feel.
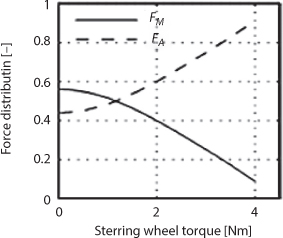
Equ. 6.1
Figure 6.9 shows the simulation of road disturbance with a sinusoidal input at two different working points where the disturbance is held constant at all conditions.
Leave a Reply