Typical performance curves of a reciprocating steam engine under test conditions are shown in Fig. 5.21.
Most of the curves are self-explanatory and should be carefully scrutinised for analysis of the variables involved.
One salient fact is that the speed curve as shown is practically horizontal with a slight drop as the load is increased, this shows good governing. The Willian’s line as shown is straight when the governing is by throttling with a fixed cut-off, and indicates a linear relationship between the total steam consumption is kg/h and the power if steam pressure is varied to suit the load. This fact is also of great advantage in predicting the part load steam consumption of steam turbines, most of which use throttle governing. 1f the steam consumption is plotted for an automatic engine with cut-off governing, the line will not be strictly straight.
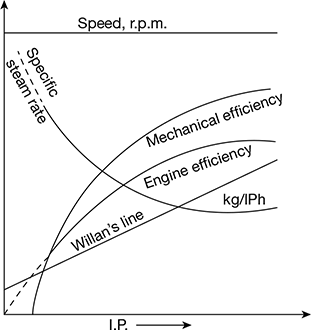
Figure 5.21
Example 5.15
In a single cylinder double acting steam engine steam is supplied at a pressure of 12 bar and exhaust takes place at 1.1 bar. The cut off takes place at 10% of the stroke which is equal to 1.25 times the cylinder bore and the engine develops and indicated power of 100 kW at 90 r.p.m., calculated the bore and stroke of the engine assuming hyperbola expansion and a diagram factor of 0.8. Also determine the theoretical steam consumption in m3/mm
Solution
Given: p1 = 12 bar, pb = 1.1 bar,v2 = 0.4v3, L = 1.25D, IP = 100 kW, N = 90 rpm, Kd =0.8
The p-v diagram is shown in Fig. 5.22.
Mean effective pressure without clearance

Expansion ratio, ![]()
pm = 0.8 [12 × 0.4 (1+ ln 2.5) + 1.1] = 6.4786 bar
Indicated power developed,![]()
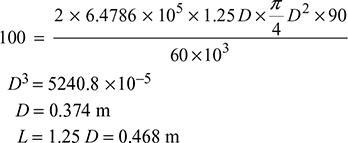
Theoretical steam consumption/min


Figure 5.22
Leave a Reply