The relationship between pressure rise and mass flow rate at various speeds is shown in Fig. 15.8. At a certain speed, efficiency increases as the mass flow rate increases and reaches a maximum value after which it decreases, as shown in Fig. 15.9. The power consumed increases as mass flow increases. Figure 15.10 shows the performance and constant efficiency curves. The performance curves are plotted with dimensionless parameters,  ,
, ![]() and
and ![]() At constant value of
At constant value of ![]() there is a considerable narrower range of mass flow rate than in centrifugal compressor. The surge point is reached in axial compressors much before the maximum pressure ratio for given value of
there is a considerable narrower range of mass flow rate than in centrifugal compressor. The surge point is reached in axial compressors much before the maximum pressure ratio for given value of ![]() . Since the design usually calls for the operating line to be near the maximum point on the
. Since the design usually calls for the operating line to be near the maximum point on the ![]() curves, it follows that the operating line for axial flow compressors must be very near the surge line, thus narrowing the range of stable operation.
curves, it follows that the operating line for axial flow compressors must be very near the surge line, thus narrowing the range of stable operation.
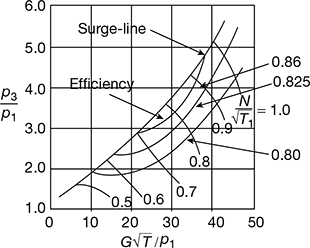
Figure 15.8 Pressure ratio v’s mass flow rate
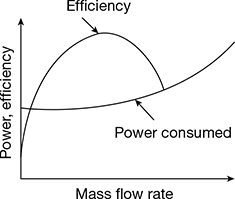
Figure 15.9 Power and efficiency v’s mass flow rate
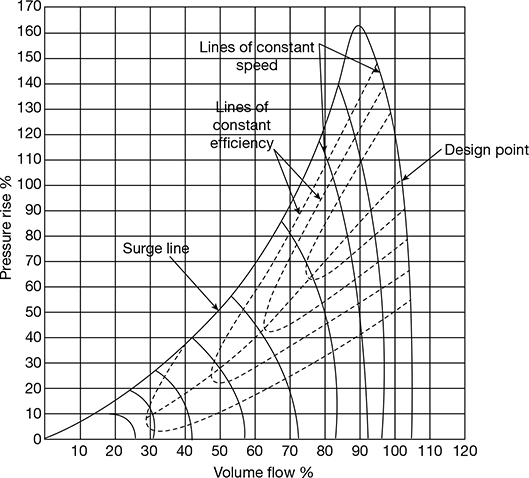
Figure 15.10 Pressure rise v’s volume flow
Leave a Reply