What is the Mat Hold candlestick pattern?
Mat hold candlestick pattern is a pattern seen in the technical analysis of stocks or commodities that show the stock will continue its previous directional trend, whether bullish or bearish.
This type of pattern is initially shown by a profitable trading day in one direction or another, followed by three small opposite trending days. The fifth day then continues the trend of the first day, pushing lower or higher, in the same direction as the movement of the first day.
The pattern is seen as a very dependable but rare indicator in technical analysis. It is mostly confused with the rising-three indicator; with the difference being that the trades on days two to four of the rising-three indicator generally stay within the high and low formed on the first day.
Investors and analysts apply this pattern when trying to predict whether the current uptrend will continue, and to what extent. Traders and analysts generally assume this chart pattern means the momentum will hold steady and the upward trend will continue.
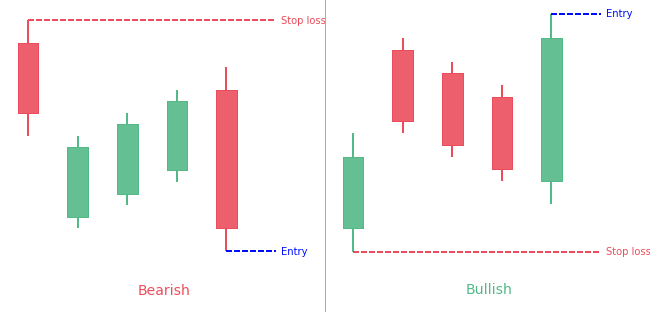
Bullish Mat Hold candlestick pattern
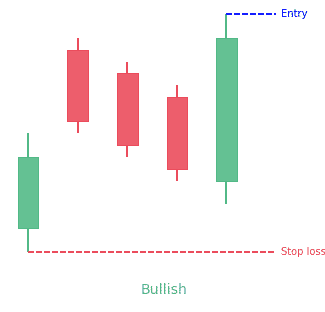
A bullish mat hold is a five-candle candlestick pattern that comes up in an ongoing uptrend and indicates that the trend will keep on being bullish. The first candle of the bullish mat hold is tall and positive and is followed by three small, negative candles. The last candle is large and bullish and closes on top of the high of the pattern.
In the bullish mat hold pattern, the first and last candles are large and bullish, while the three candles in between are small and bearish.
Characteristics of a Bullish Mat Hold Pattern
- The first candle is tall and positive and appears in a bullish trend
- The next three candles are bearish and close lower than the initial bar
- The last candle is large and bullish and manages to close over the high of the pattern
Bearish Mat Hold candlestick pattern
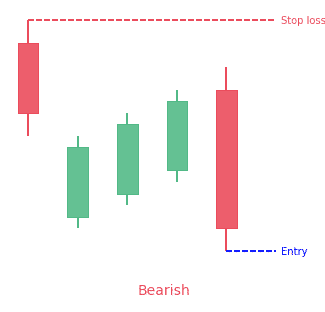
This is a five-candle bearish continuation pattern that appears in a bearish trend and indicates that the market is making a temporary pause, after which it is expected to continue going down. In a bearish mat hold, there are five candlesticks. The first and fifth are negative, while the three intervening candles are positive.
Characteristics of a Bearish Mat Hold
- The first candle is tall and bearish, and part of the bearish trend
- Second, third, and fourth candles are small and bullish
- Fifth, the last candle is large and bearish and closes less than the low of the pattern
Inverted Mat Hold pattern
An inverted mat hold pattern is made up of five Japanese candlesticks. This is a variation of the three-method structure. The first is a big bearish candlestick (red), followed by three little bullish candlesticks (green). Each small candlestick has to close higher than the previous one. The opening of the second candlestick has to be on a bearish gap. Lastly, the final candlestick has to also open on a bearish gap and close below the lower point of the second candlestick. The pattern is also known as an inverted saucer pattern.
How to identify the Mat Hold candlestick pattern?
A mat hold structure is made up of five Japanese candlesticks. This is a variation of the three methods structure. The first is a big bullish candlestick (green), then three small bearish candlesticks (red). Each small candlestick has to close lower than the previous one. The opening of the second candlestick has to be on a bullish gap. Lastly, the final candlestick has to also open on a bullish gap and close above the high point of the second candlestick. The pattern is also known as a rising three-method pattern.
What does the Mat Hold pattern tell traders?
Bullish Mat Hold
As the current market trend is positive, a lot of investors and traders believe that prices are going to continue rising. As a result of this belief, the market forms the first positive candle of the bullish mat hold.
But after going up for some time, the market is becoming over-saturated, with many buyers trooping in. Similarly, more and more market participants start to worry that a correction may be close by, because of the strong developments of the last period.
Due to this, more traders try to get out of their position, which causes the flow of sell orders to hit the market. This makes the three bearish candles to form.
Now, despite the absence of a pullback, it didn’t get too serious. This brings new life to the bullish sentiment, which takes its chance to move the market higher, forming the last, bullish candle. The bullish mat hold is a story about an advancing market that performed a plain, ordinary pullback before it advanced to new heights.
Bearish Mat Hold
Since the market is now negative, most traders have a negative outlook and believe that there will be lower prices. As a result, selling pressure is high, and the market makes the first negative candle of the bearish mat hold. Now, having crashed for some time, the market is becoming oversold, which raises the possibility of a pullback.
As traders realize this, they stop giving out sell orders, hoping that a pullback will occur. This then gives way for the bullish market participants and their buy orders, which drive the market up for the coming three bars.
Even though the market has managed to make three positive candles, they were short and insignificant. This indicates that bears still are in control, and that bulls are weak.
As the market makes the last, bearish candle, it confirms that what we saw was nothing but a temporary pullback and that the market now is going lower.
How to trade when you see the Mat Hold candlestick pattern?
The implication of the mat hold candlestick pattern is that the trend has not been stopped. This is a good point to add to positions. The pattern is a stronger continuation pattern than the other methods. During the days of ‘rest,’ the price stays close to the top of the upper range of the white candle.
Criteria
- An uptrend is happening, which forms a long white candle
- A gap up day that closes lower than its open makes a small black candle
- The next two days make small candles
- The last day gaps-up and closes above the trading ranges of the previous four days
Pattern psychology
This candlestick pattern does not pull back as much as other trading methods, and it is easier to identify. The pull-back days are less concerning and the relatively flat rest period does not make the same amount of concern. There are three days in which the bears are not able to knock the price down to any great degree and as a results the bulls step back in with confidence.
The investment psychology made into candlestick signals makes it easier to understand what is happening in the mind of an investor. The signals were made through hundreds of years of visual analysis and interpretation by successful rice traders from Japan.
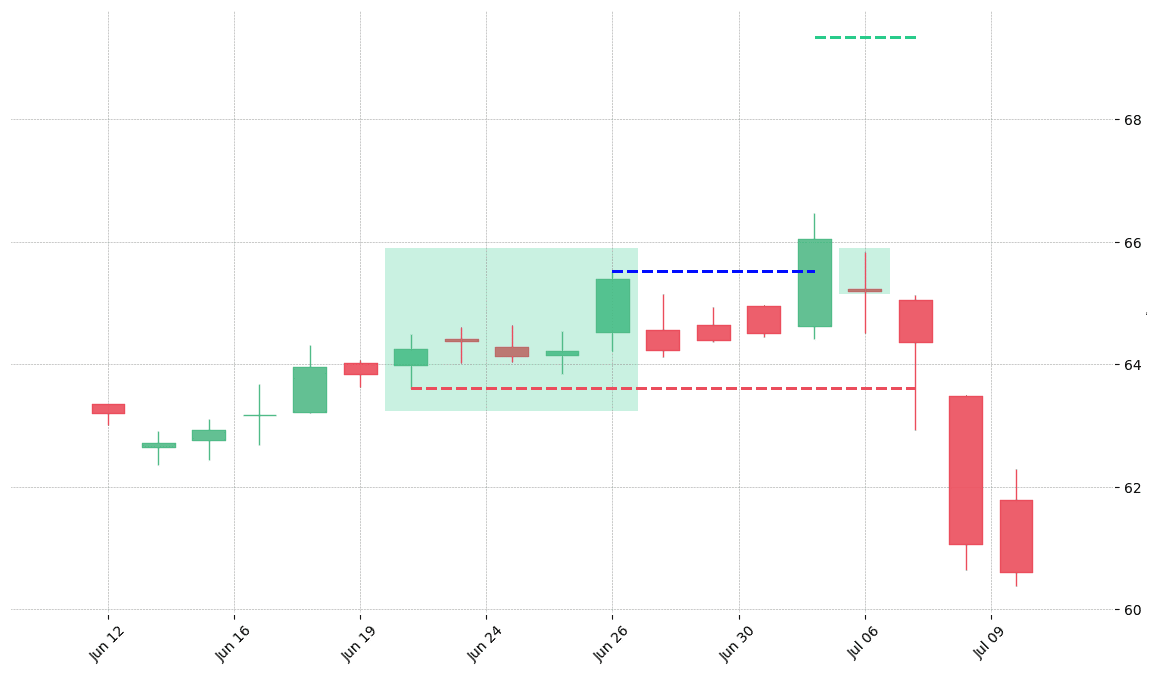
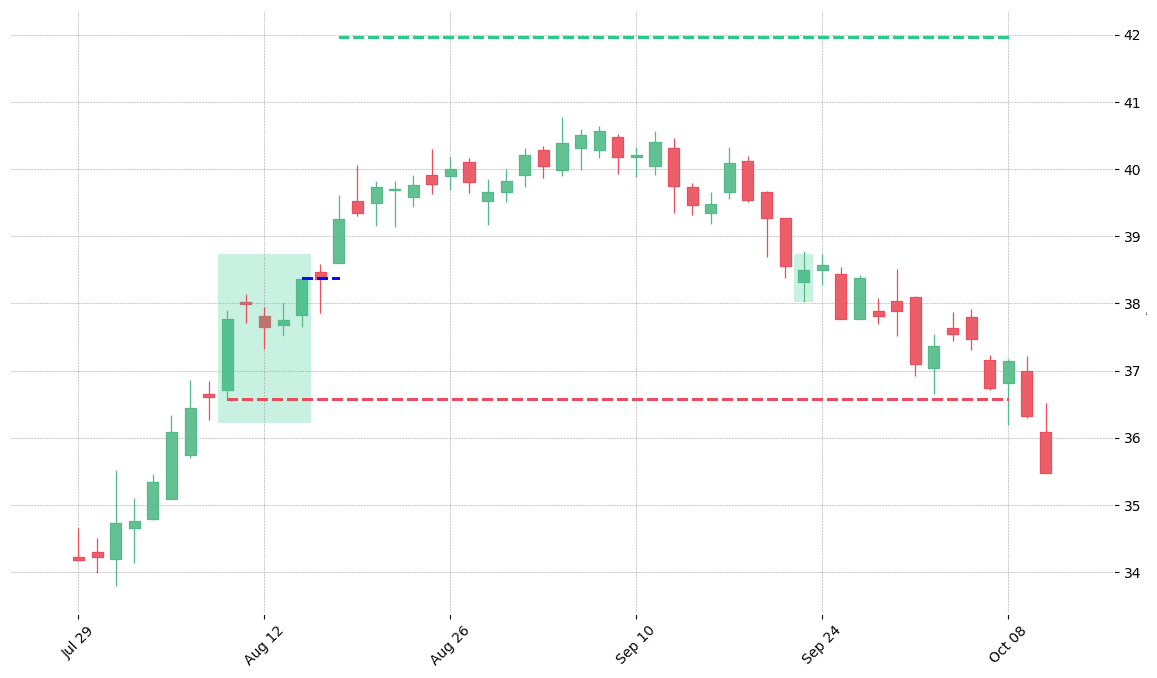
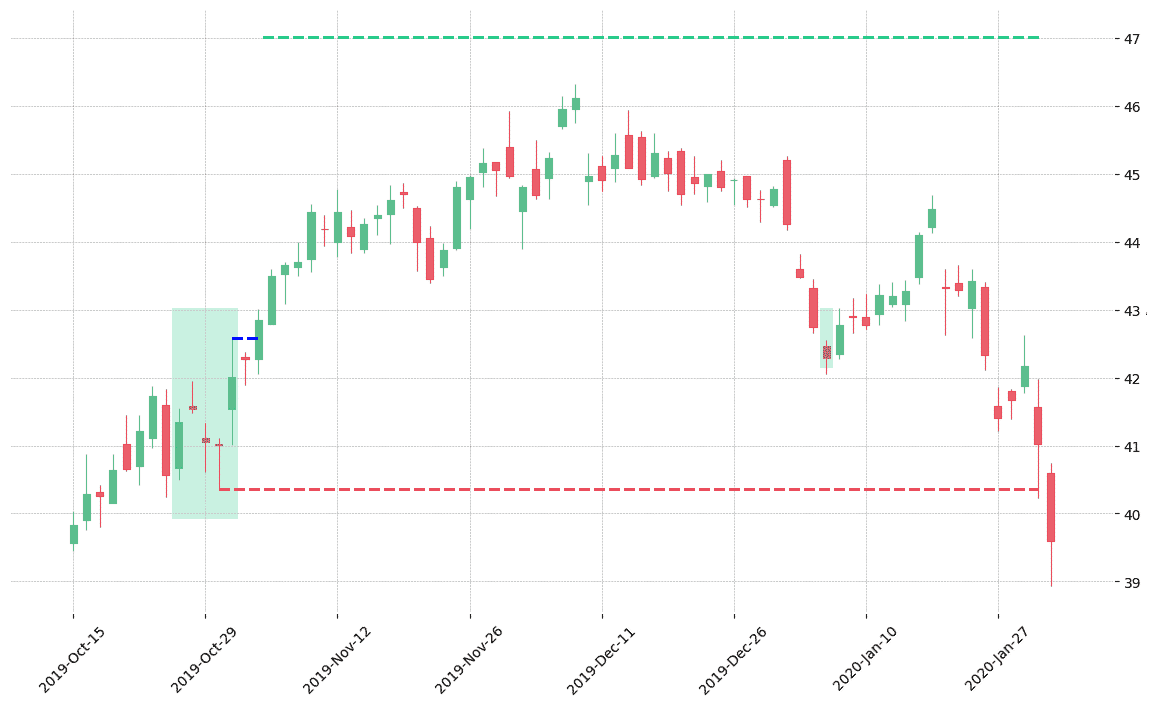
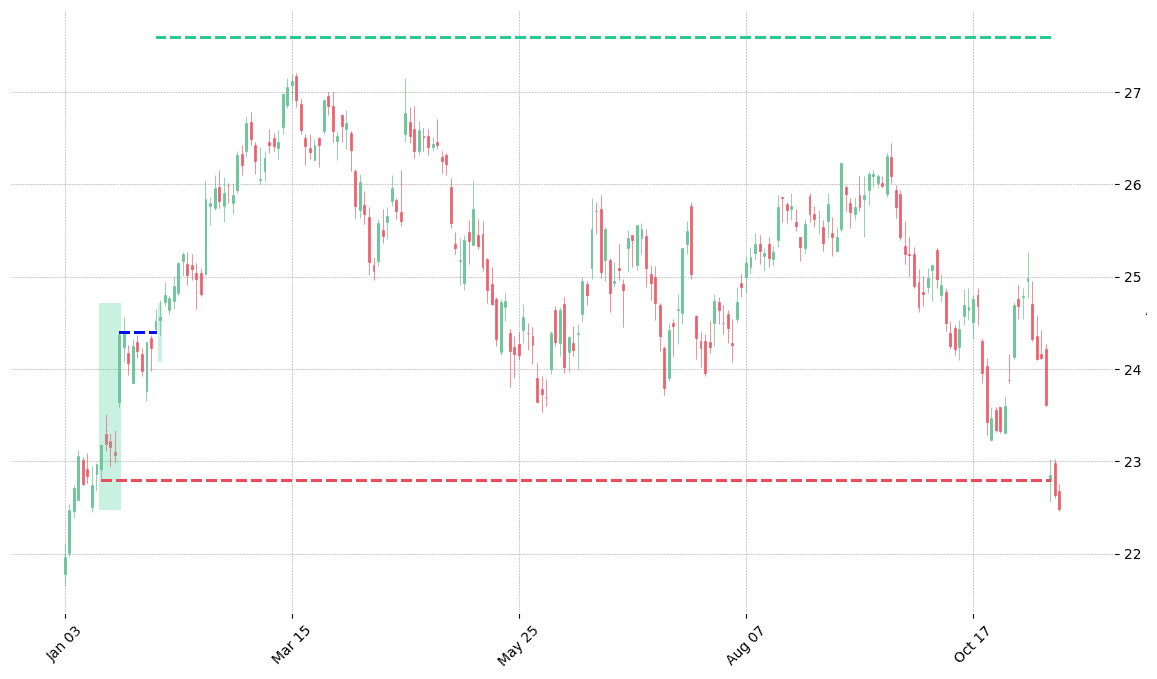
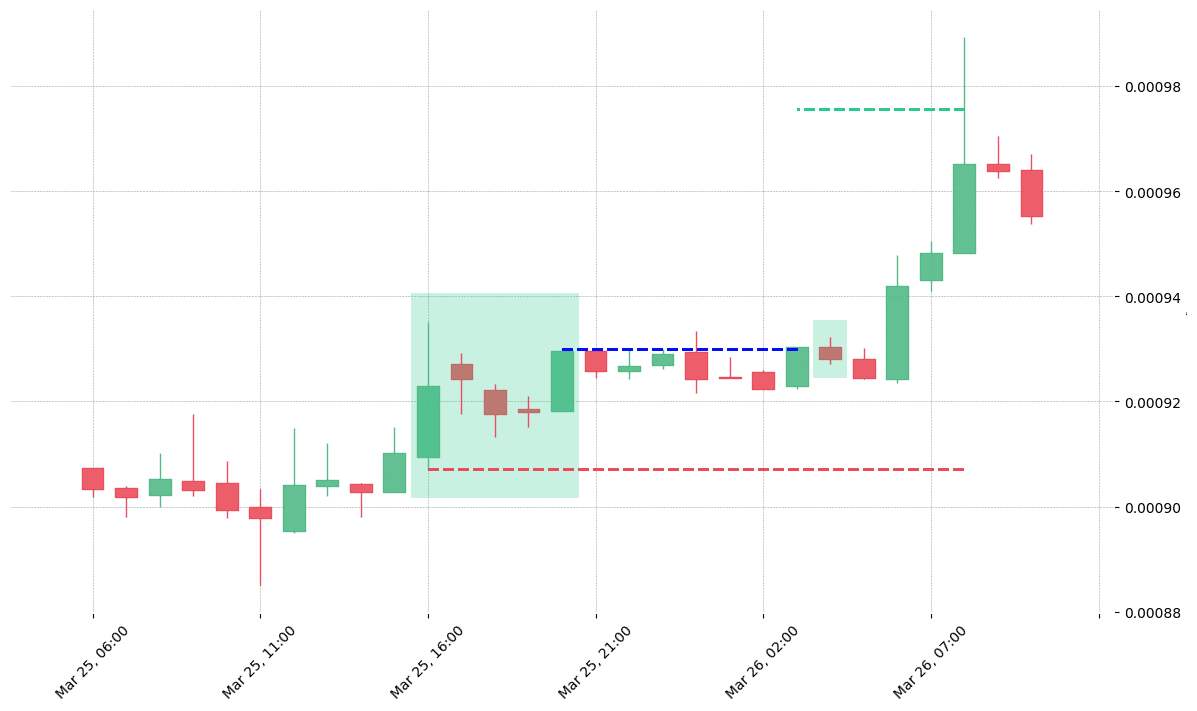
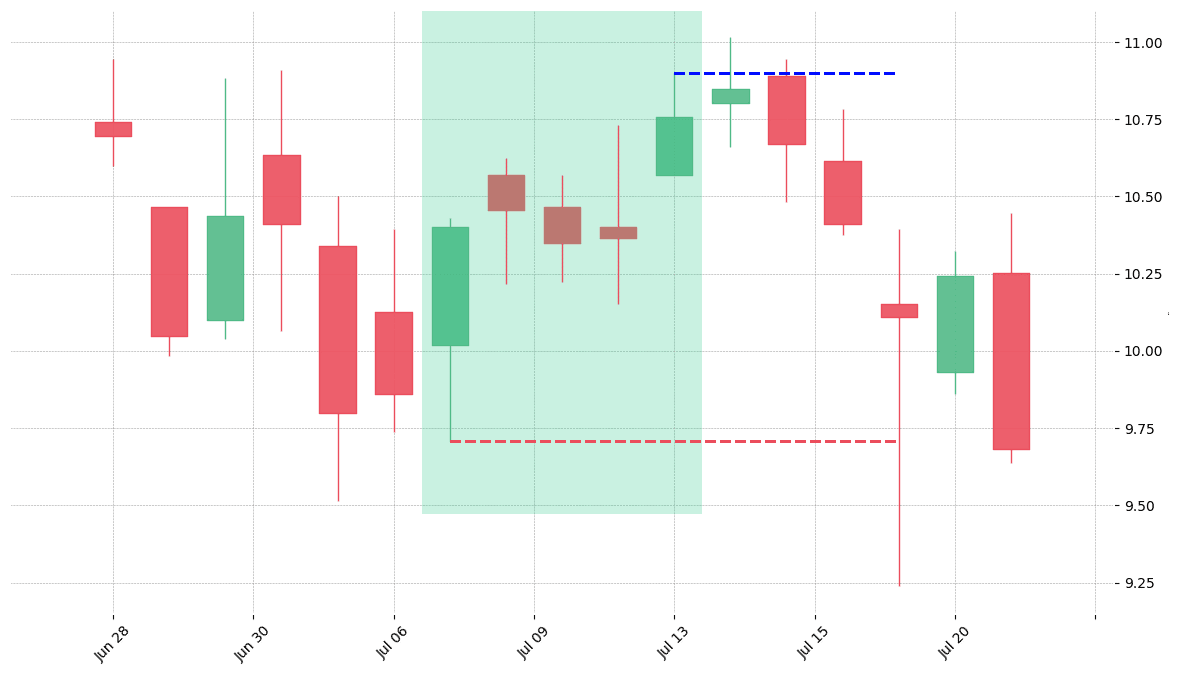
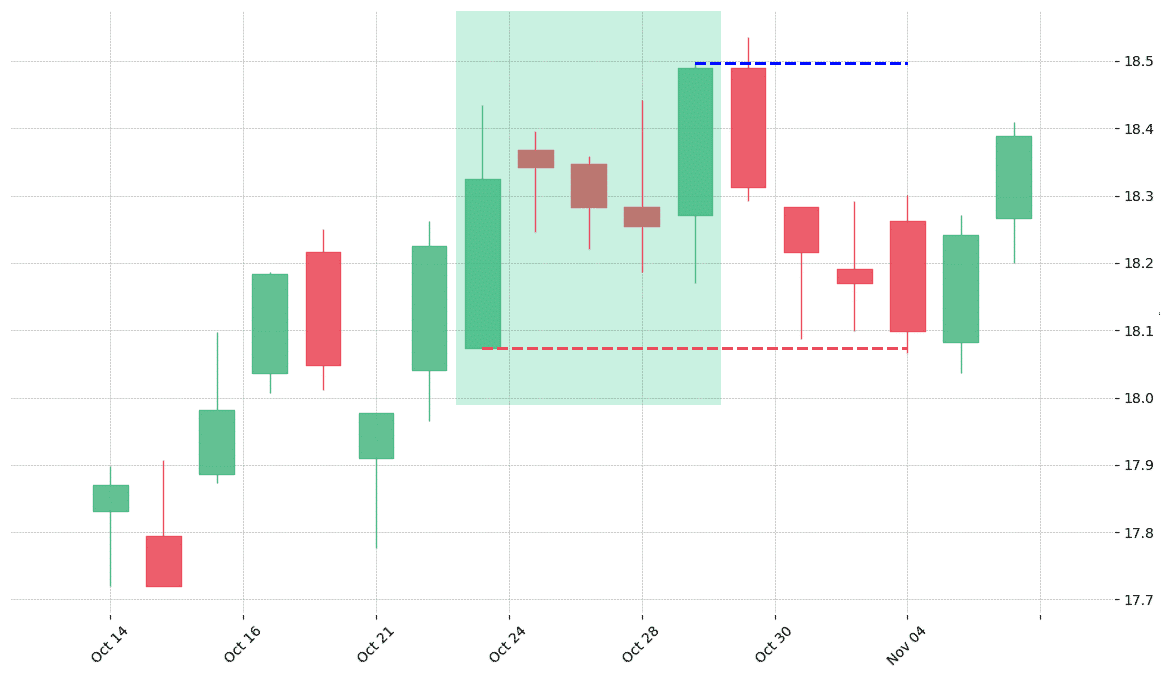
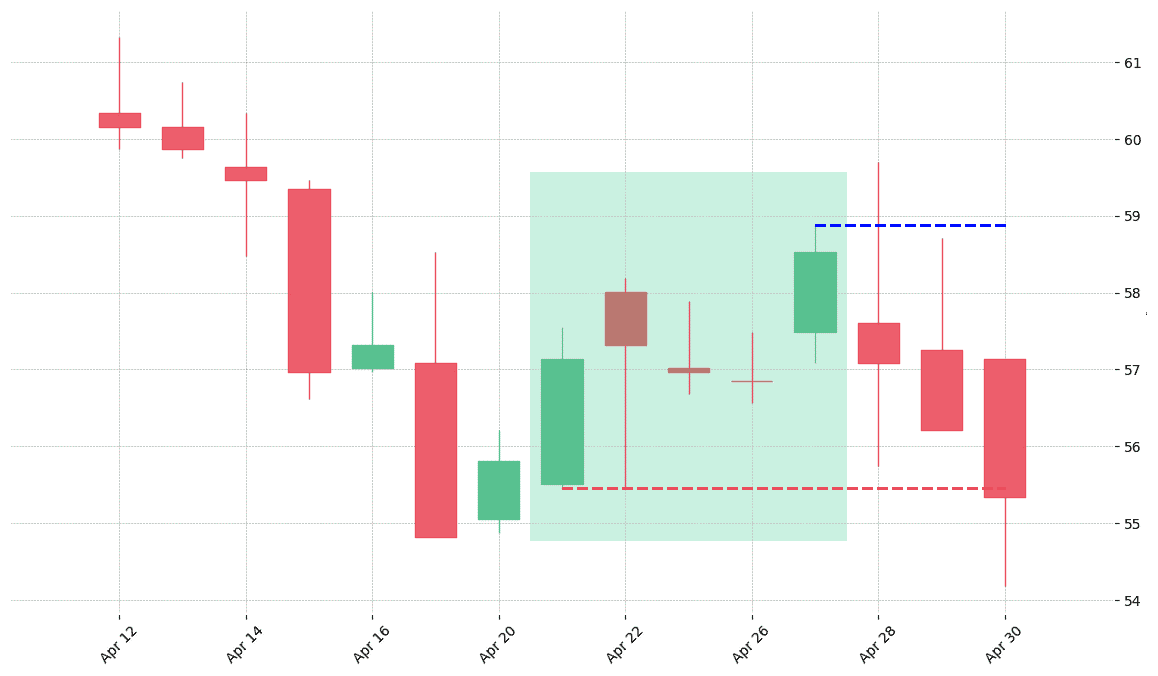
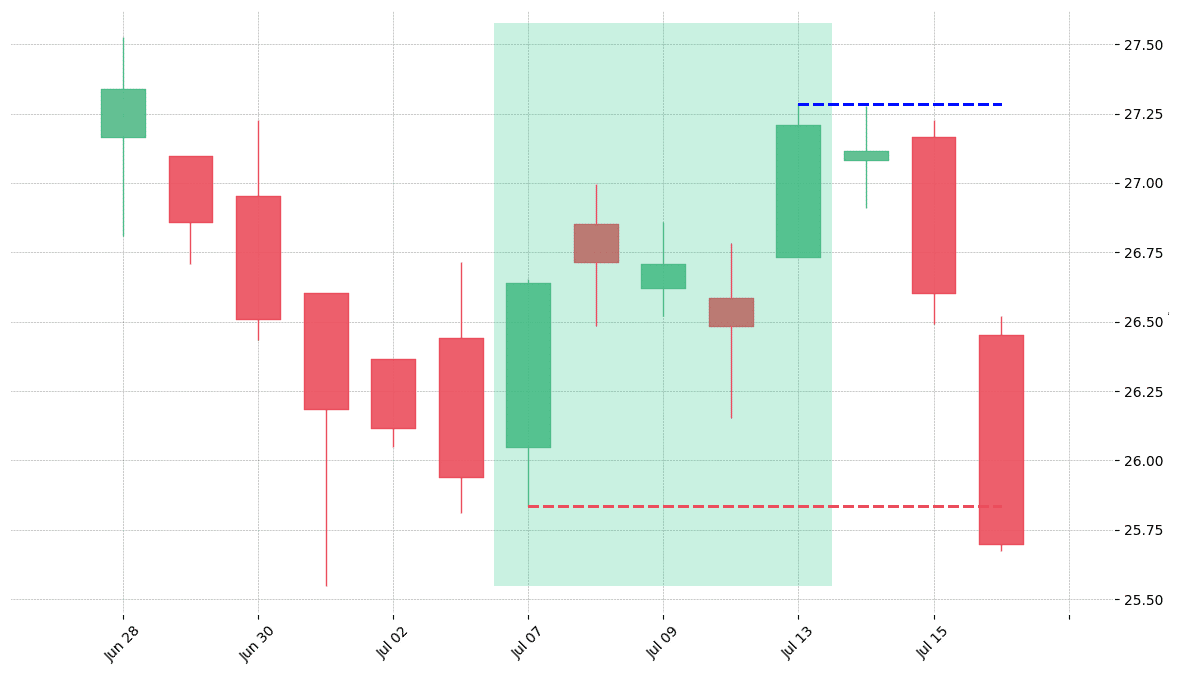
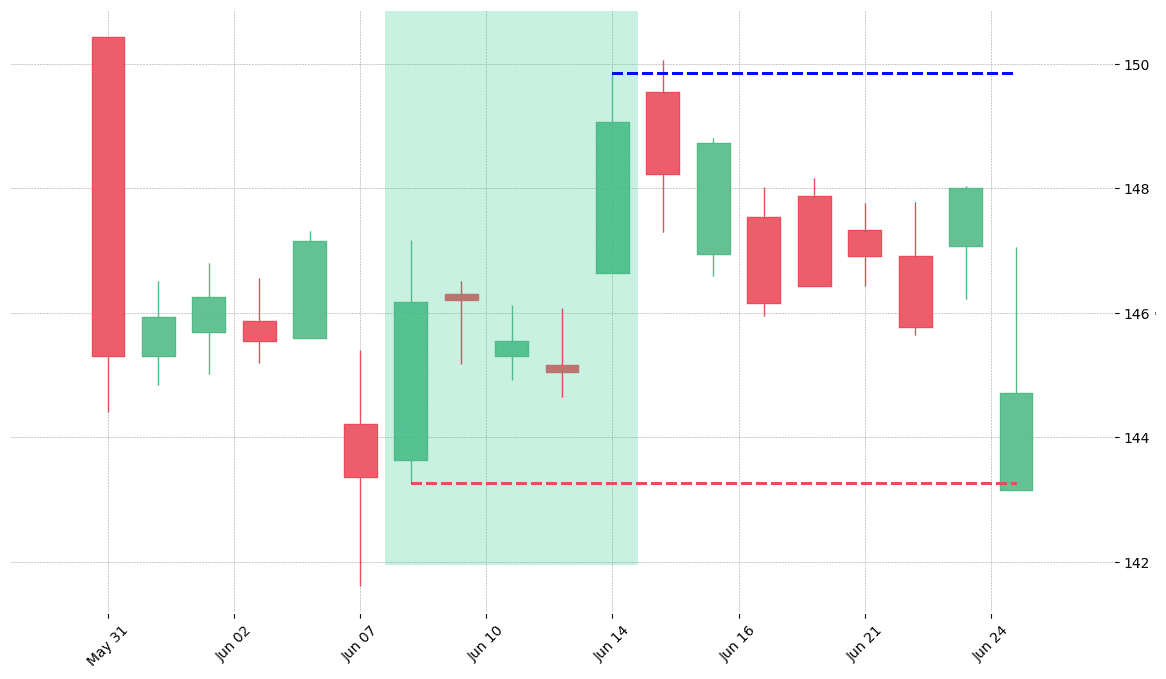
How does the Mat Hold pattern look in real life?


Leave a Reply