The theoretical of p − V diagram for the single-stage reciprocating compressor is represented by 1–2–3–4–1 in Fig. 12.17. The actual indicator diagram is 1–2′–3–4′–1. The difference between the actual and theoretical indicator diagrams is due to the intake and discharge losses. The intake losses include the friction losses in pipe, friction loss in inlet valve, and valve inertia loss. Theoretically, the inlet valve should open at 4, but actually, it opens little afterwards at 4′ due to the inertia of the valve, and the pressure inside the cylinder falls below the atmospheric pressure. The oscillating part of the curve indicates valve flutter due to vibration of spring loaded valve. On the delivery side, the discharge valve should open at 2, but actually, it opens little afterwards at 2′ due to the inertia of the spring loaded discharge valve. The effect of these losses is to increase the work required by the compressor.
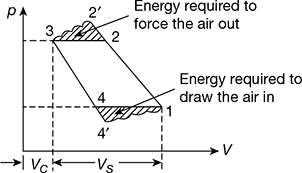
Figure 12.17 Actual p−V diagram for single stage compressor
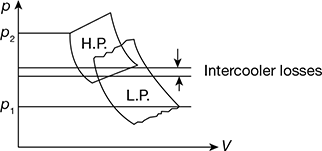
Figure 12.18 Actual p−V diagram for two-stage compressor
The actual indicator diagram for two-stage compressor with intercooler is shown in Fig. 12.18.
Leave a Reply