How a Homing Pigeon candlestick pattern is formed?
During a downtrend, a black candle is formed on the first day. The second candle is a short black candle showing a narrow trading range. It is also engulfed in the first line that shows that it is included in the first day’s trading range. This weakens the power of the downtrend. It predicts the arrival of buyers on the market which may result in a reversal of the trend.
How to identify the pattern?
As we have already discussed that a Homing Pigeon candlestick pattern consists of two candle lines. It appears usually in the downtrend. Therefore, you should look for a two-line candlestick pattern in a downtrend. It should be a long black body on the first day followed by a second black body that is contained in the first body.
What does a Homing Pigeon candlestick pattern tell traders?
There are many bearish traders and investors on the market who strongly believe that it will continue to fall. When the first candle of the Homing Pigeon candlestick pattern is formed, the same scenario develops. The formation of a long bearish candle confirms the possibility of an upcoming bearish trend. After some quieter buying period, some buying pressure begins to establish itself. Traders assume the reversal of the trend in the market. This assumption causes a gap between the two candlesticks. However, the buying pressure still fails to move the market up, hence making the second candle bearish.
How to trade the pattern?
In a Homing Pigeon candlestick pattern, a trader should enter a long position. Placing the stop loss below the low of the pattern is a wise move. They can also place the stop loss below the low of the second line as well.
During a downtrend, traders should wait for enough for the prices to decrease after the formation of the Homing Pigeon pattern. Now, they should enter a short position, and placing the stop loss above will be a wise decision.
However, it must be remembered that the Homing Pigeon pattern does not give a price target. It is possible that a new trend may start after the patter or price may not move at all. Therefore, traders should base price target on a well-defined risk-reward, a well-measured move, or according to a trading strategy and risk management.
How does the Homing Pigeon pattern look in real life?
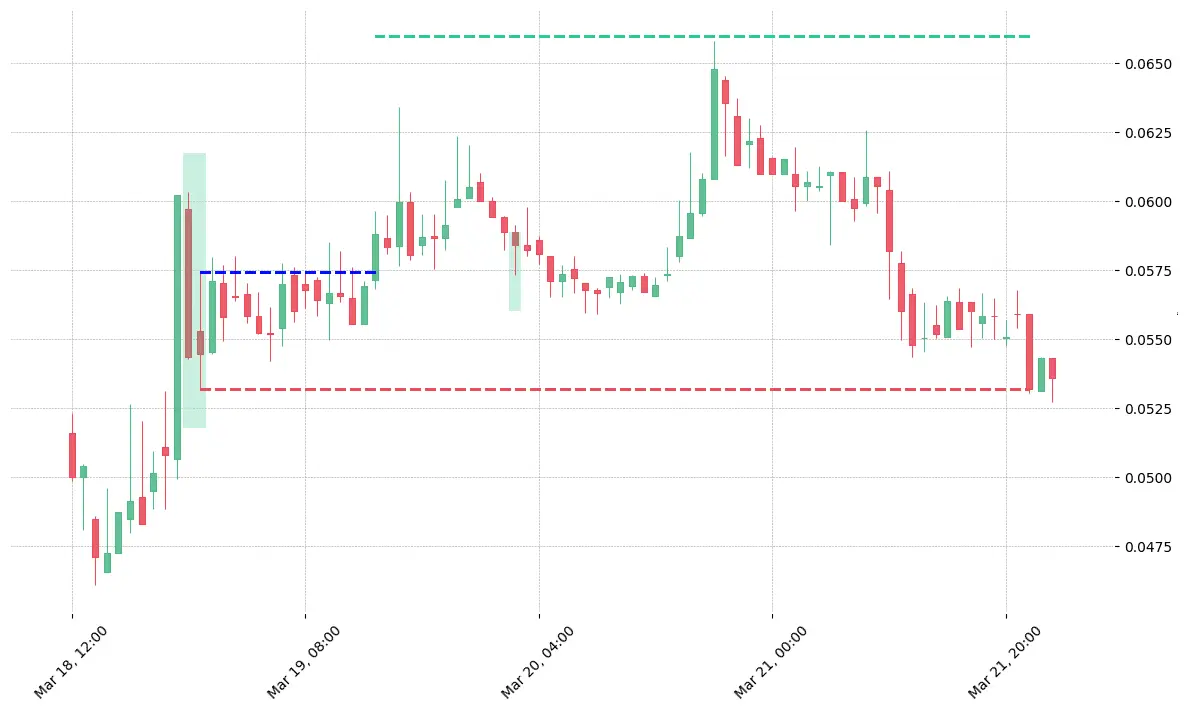
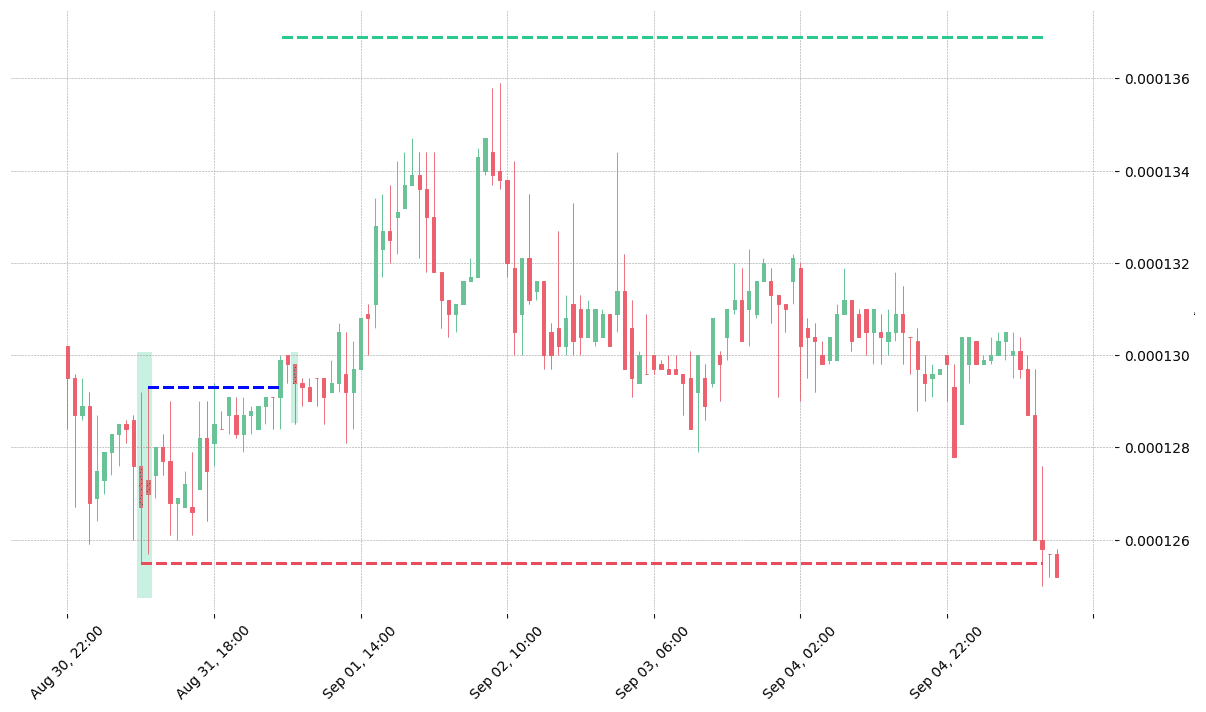
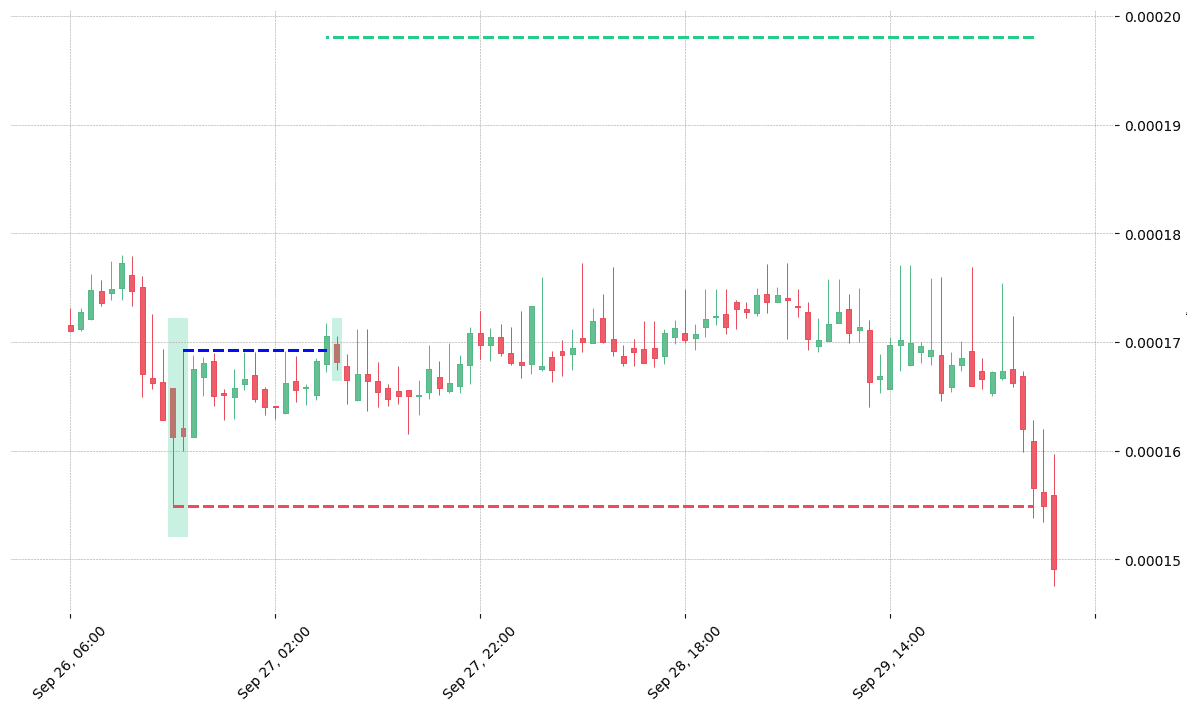
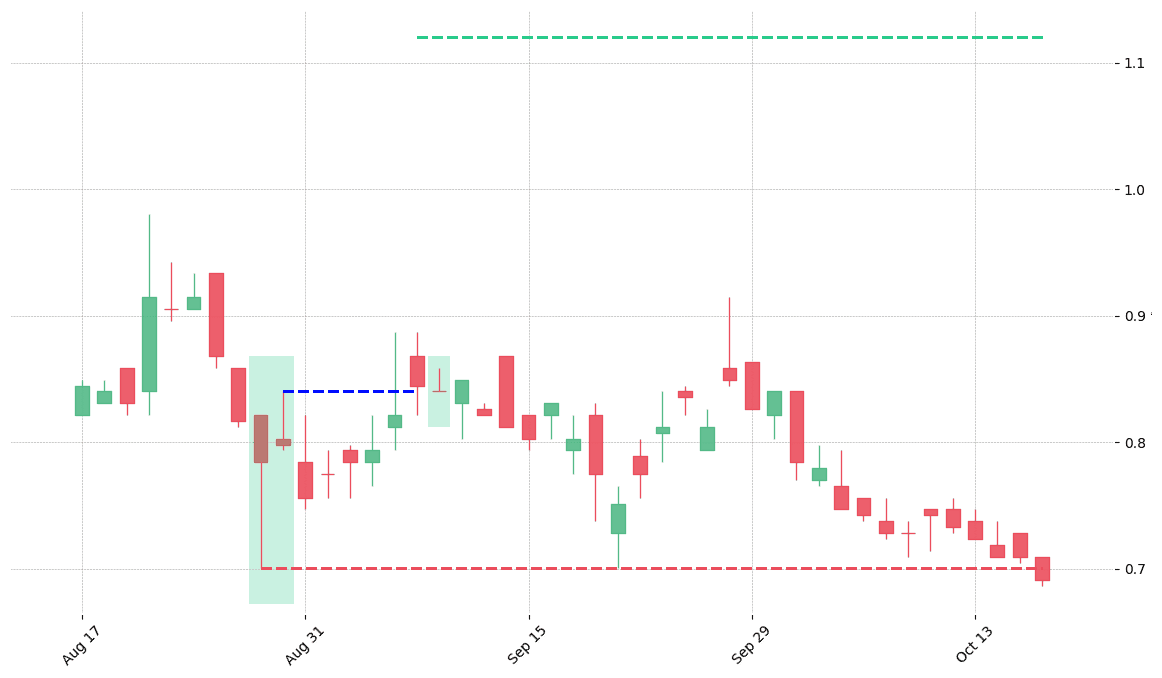
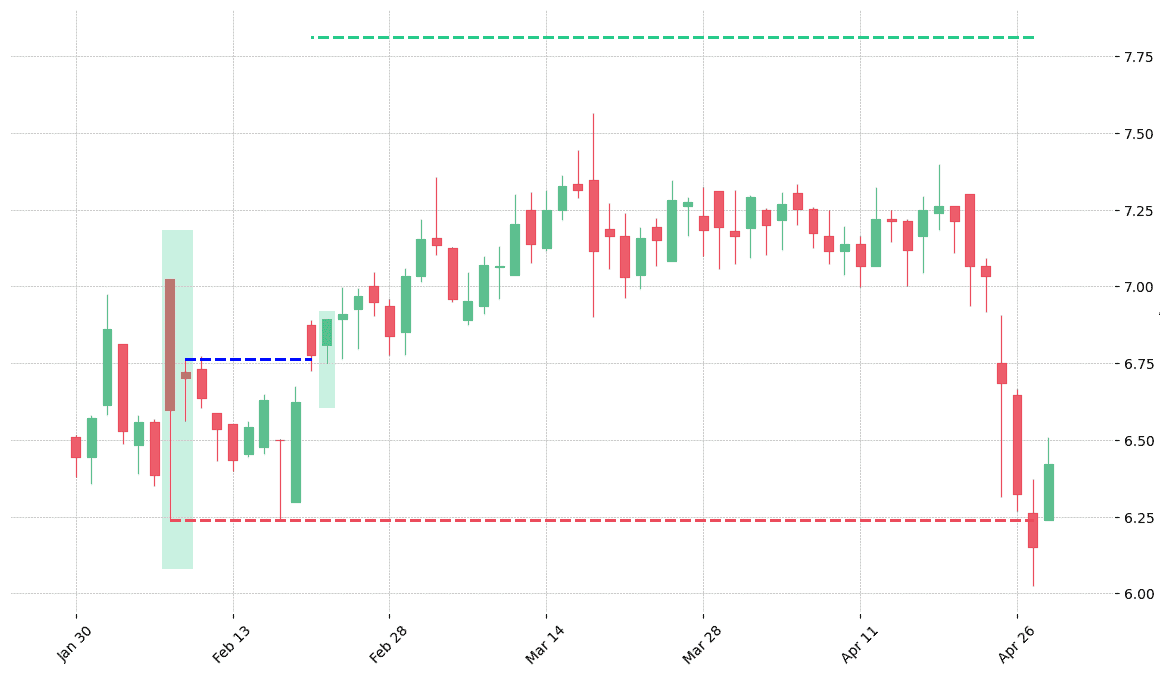
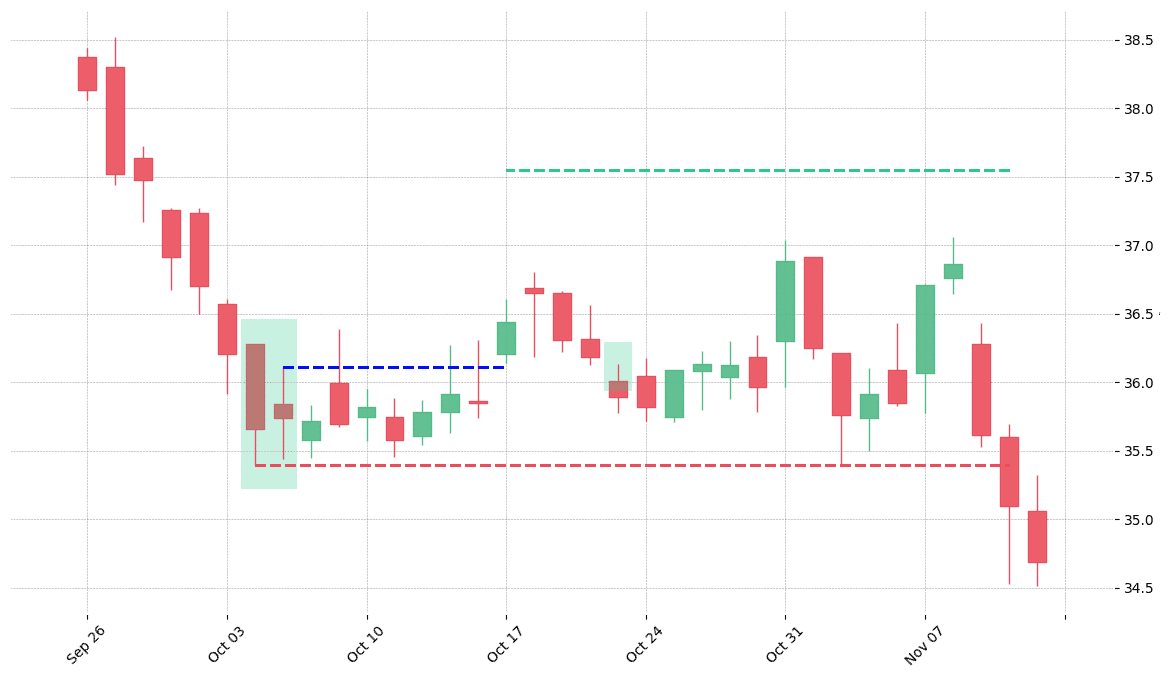
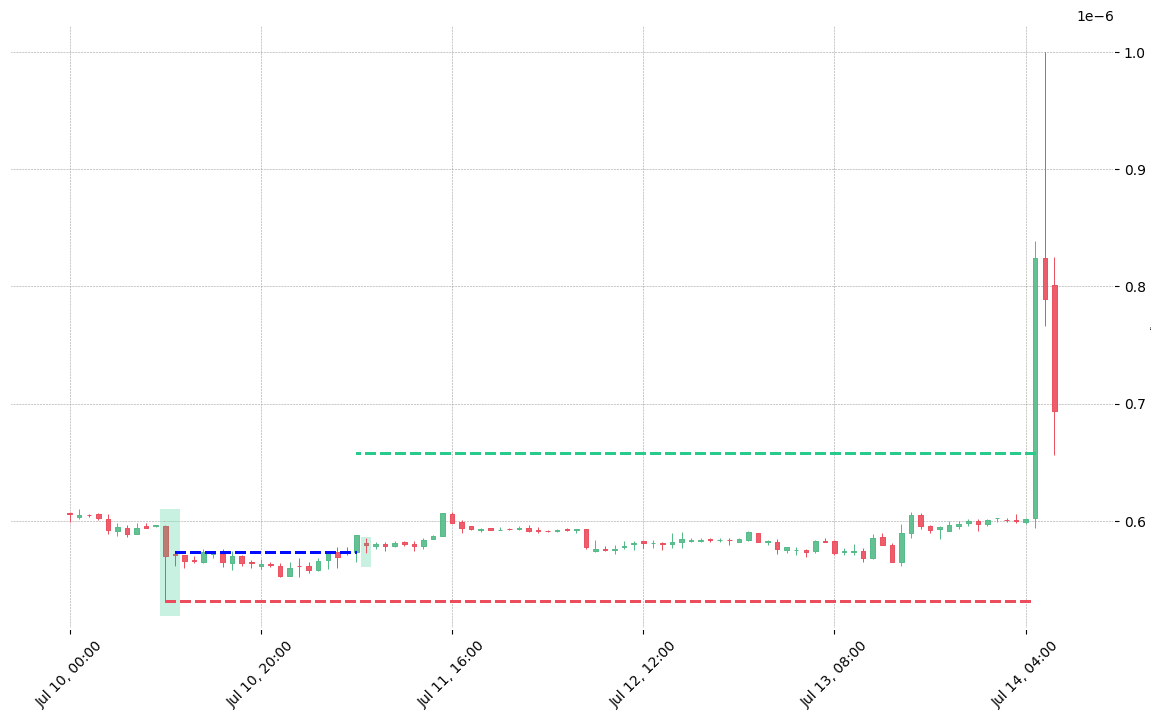
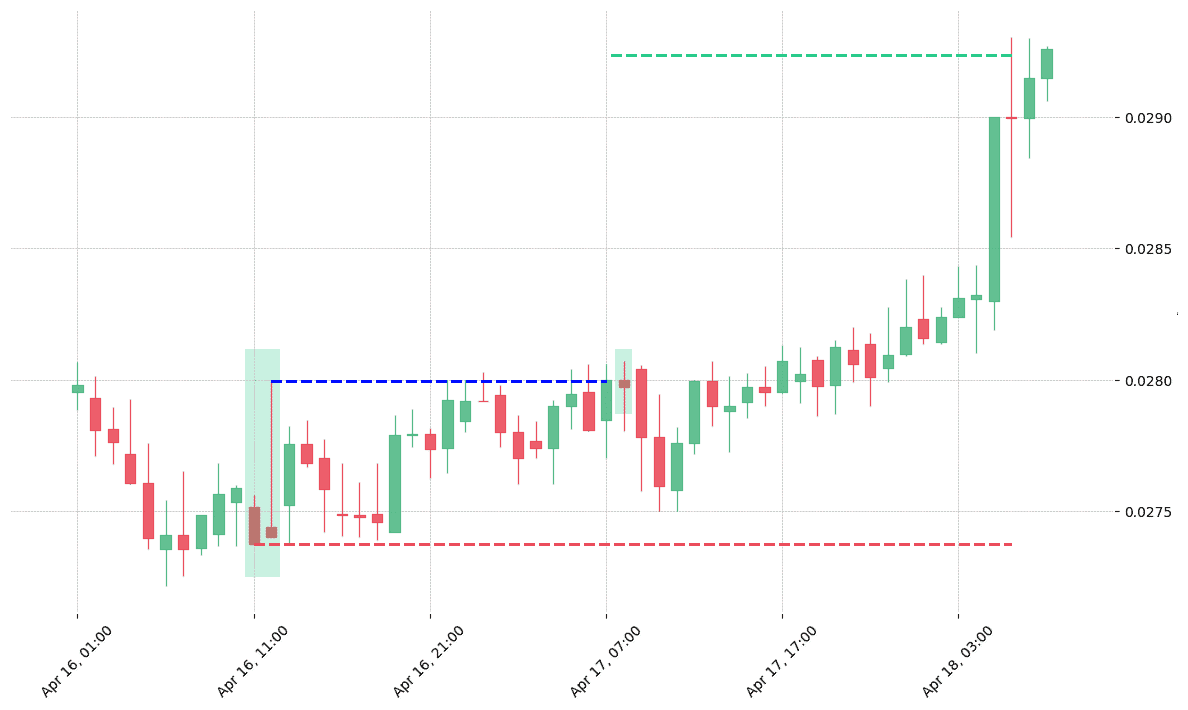
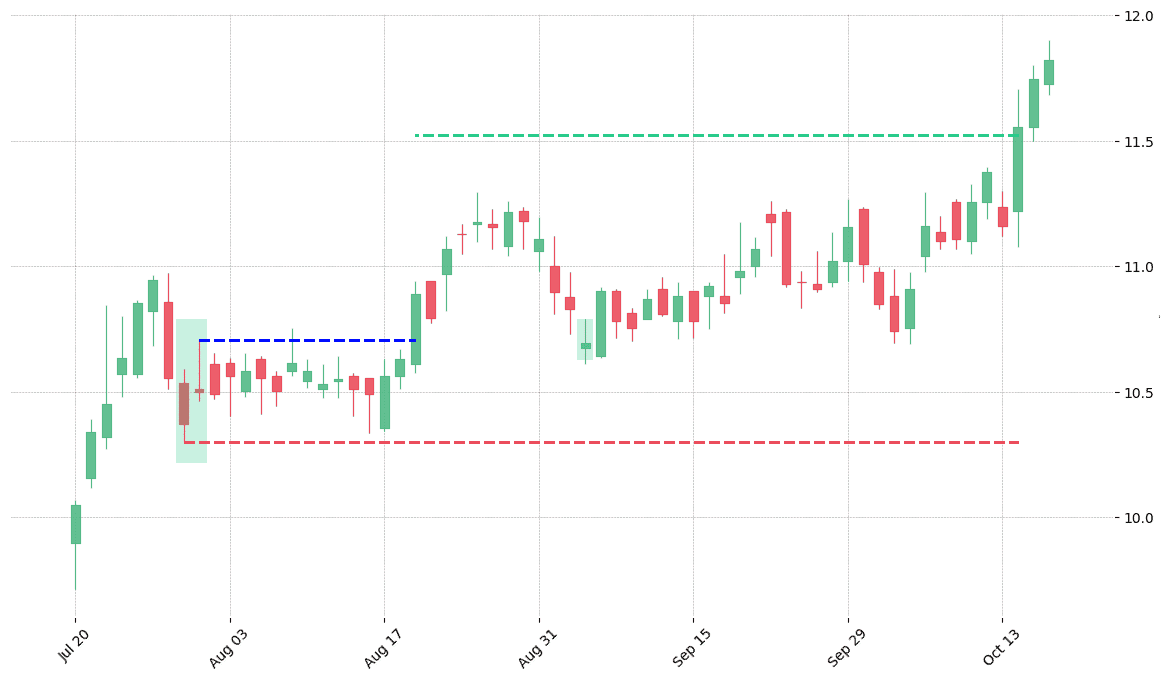
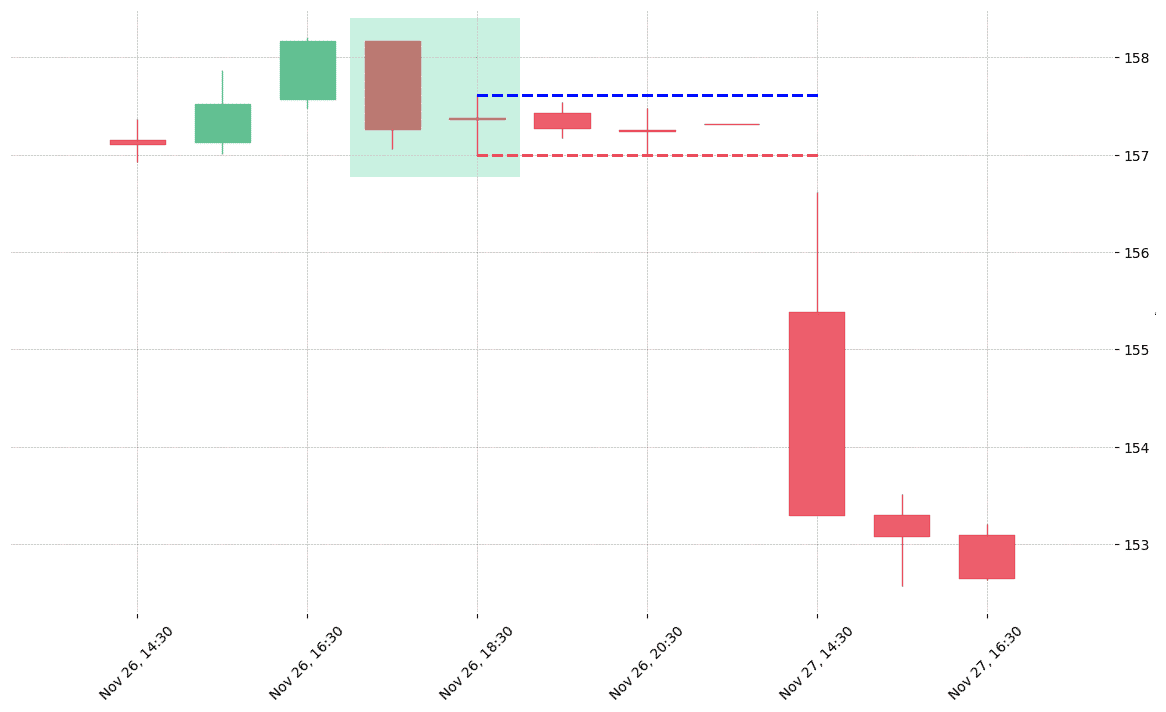
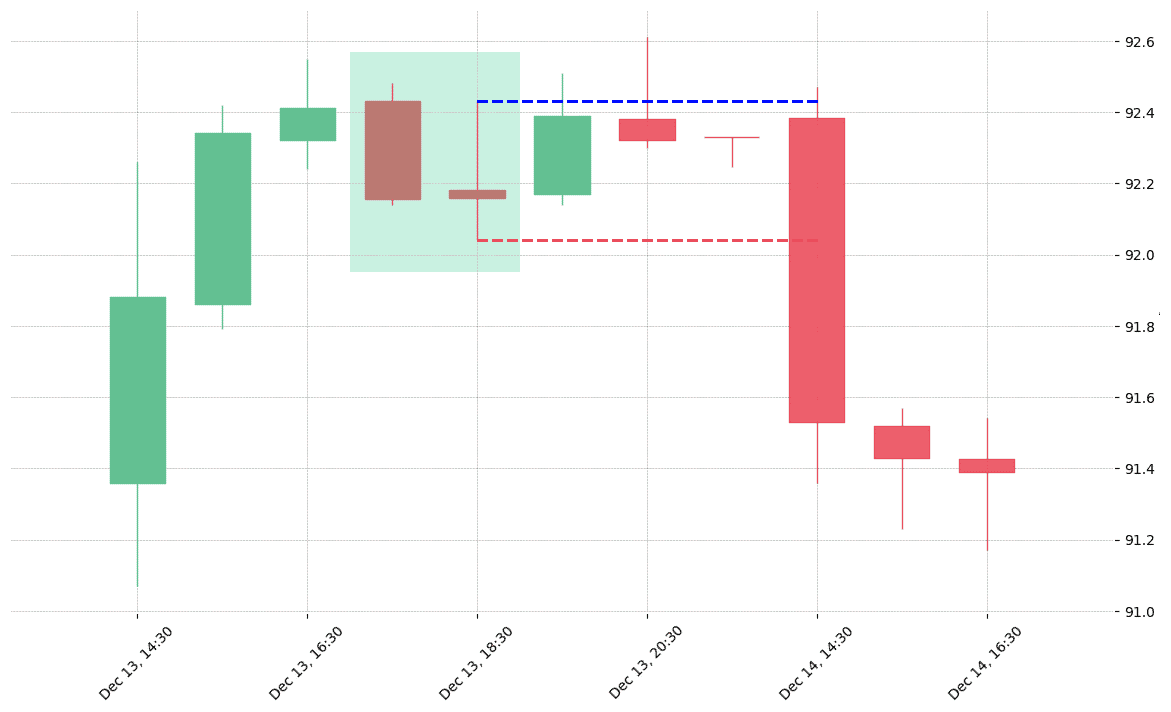
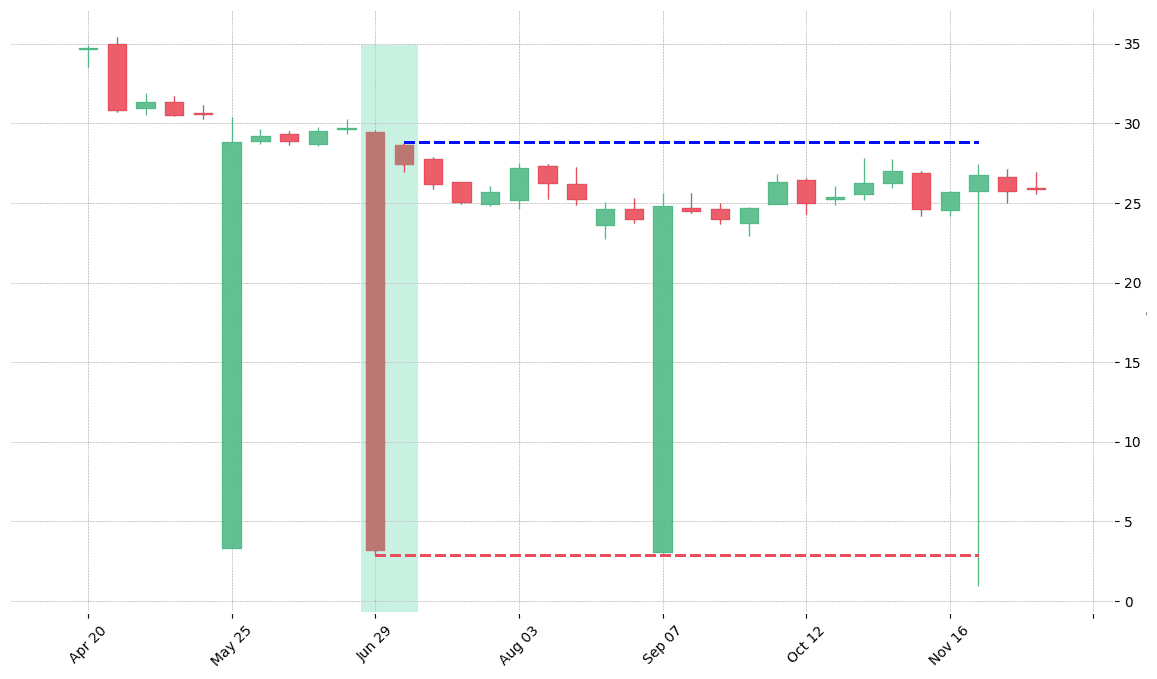
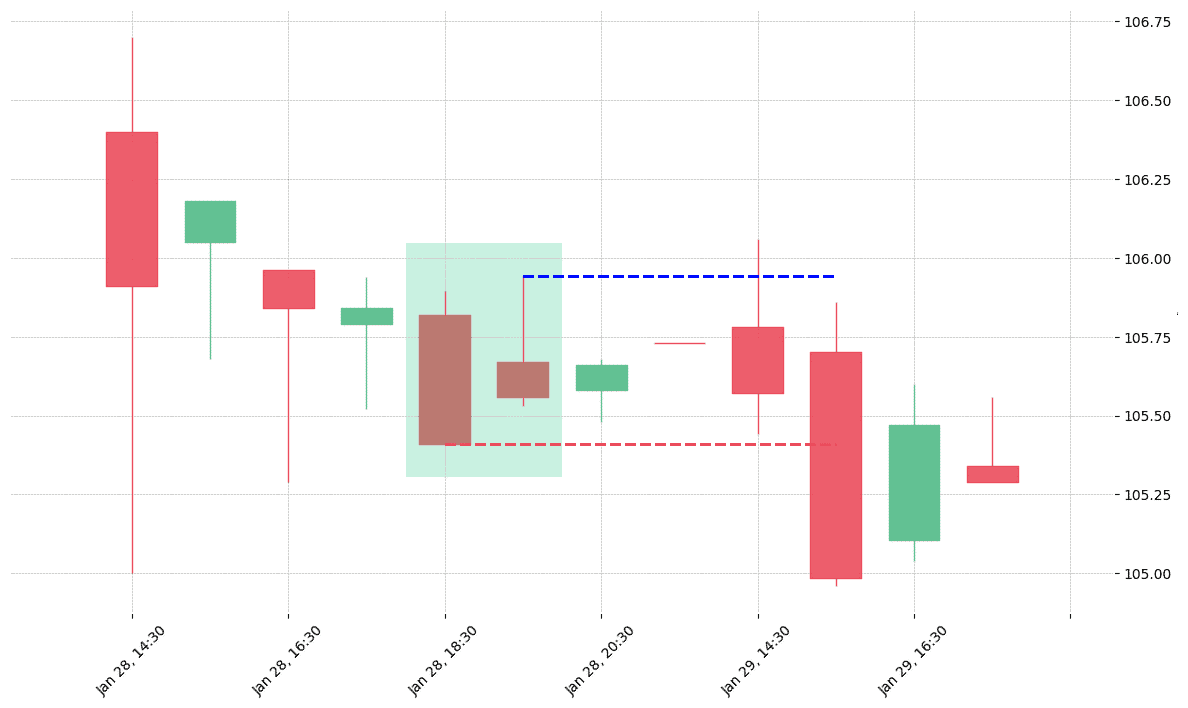
The cryptocurrency pair BCPT/BNB printed a bullish Homing Pigeon on 2018-03-18 22:00:00. It confirmed on 2018-03-19 14:00:00 (meaning price closed above entry level). It retested the trade entry level on 2018-03-20 02:00:00. Then it failed to reach the 2:1 R/R target and got stopped on 2018-03-21 22:00:00.The cryptocurrency pair VIA/BTC printed a bullish Homing Pigeon on 2018-08-31 08:00:00. It confirmed on 2018-09-01 03:00:00 (meaning price closed above entry level). It retested the trade entry level on 2018-09-01 05:00:00. Then it failed to reach the 2:1 R/R target and got stopped on 2018-09-05 11:00:00.The cryptocurrency pair WIN/USDC printed a bullish Homing Pigeon on 2019-09-26 16:00:00. It confirmed on 2019-09-27 07:00:00 (meaning price closed above entry level). It retested the trade entry level on 2019-09-27 08:00:00. Then it failed to reach the 2:1 R/R target and got stopped on 2019-09-30 04:00:00.The stock ATVI printed a bullish Homing Pigeon on 1998-08-27. It confirmed on 1998-09-08 (meaning price closed above entry level). It retested the trade entry level on 1998-09-09. Then it failed to reach the 2:1 R/R target and got stopped on 1998-10-16.The stock CNC printed a bullish Homing Pigeon on 2006-02-07. It confirmed on 2006-02-21 (meaning price closed above entry level). It retested the trade entry level on 2006-02-22. Then it failed to reach the 2:1 R/R target and got stopped on 2006-04-27.The stock PEG printed a bullish Homing Pigeon on 2016-10-04. It confirmed on 2016-10-17 (meaning price closed above entry level). It retested the trade entry level on 2016-10-21. Then it failed to reach the 2:1 R/R target and got stopped on 2016-11-10.The stock VZ printed a bullish Homing Pigeon on 2014-08-07. It confirmed on 2014-08-25 (meaning price closed above entry level). It retested the trade entry level on 2014-08-26. Then it failed to reach the 2:1 R/R target and got stopped on 2014-10-15.The cryptocurrency pair GSC/BTC printed a bullish Homing Pigeon on 2020-07-10 10:00:00. It confirmed on 2020-07-11 06:00:00 (meaning price closed above entry level). It retested the trade entry level on 2020-07-11 07:00:00. Then it successfully reached the 2:1 R/R target.The cryptocurrency pair ZEC/BTC printed a bullish Homing Pigeon on 2018-04-16 11:00:00. It confirmed on 2018-04-17 07:00:00 (meaning price closed above entry level). It retested the trade entry level on 2018-04-17 08:00:00. Then it successfully reached the 2:1 R/R target.The stock PFE printed a bullish Homing Pigeon on 2009-07-29. It confirmed on 2009-08-19 (meaning price closed above entry level). It retested the trade entry level on 2009-09-03. Then it successfully reached the 2:1 R/R target.The stock CMA printed a bullish Homing Pigeon on 2020-03-26 16:30:00. Unfortunately it invalidated on 2020-03-27 13:30:00 before the trade could trigger (it triggered the stop before entering).The stock LIN printed a bullish Homing Pigeon on 2018-11-26 17:30:00. Unfortunately it invalidated on 2018-11-27 14:30:00 before the trade could trigger (it triggered the stop before entering).The stock PNW printed a bullish Homing Pigeon on 2018-12-13 17:30:00. Unfortunately it invalidated on 2018-12-14 14:30:00 before the trade could trigger (it triggered the stop before entering).The stock TPR printed a bullish Homing Pigeon on 2015-06-29. Unfortunately it invalidated on 2015-11-23 before the trade could trigger (it triggered the stop before entering).The stock WST printed a bullish Homing Pigeon on 2019-01-28 18:30:00. Unfortunately it invalidated on 2019-01-29 15:30:00 before the trade could trigger (it triggered the stop before entering).


Leave a Reply