Hanging Man Candlestick Pattern

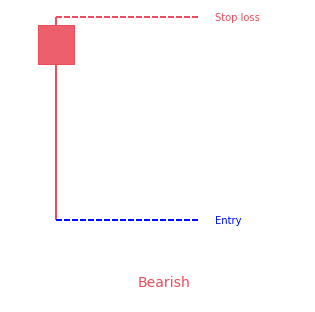
How is the Hanging Man candlestick pattern formed?

It is very interesting to know that it closely resembles the Hammer, Inverted Hammer, and the Shooting Star candlestick patterns. This resemblance, especially to Hammer candlestick pattern, is amazing. Just like the Hammer, its formation also begins when the following two conditions are fulfilled

  • When open, close, and high prices are almost similar 
  • The long lower shadow is at least twice bigger than the body

When these two conditions are fulfilled, a bearish Hanging Man candlestick pattern is formed. When opening and high prices are the same, it is considered to be the strongest bearish sign for the traders. On the contrary, when closing and high prices are the same, it is considered less bearish.

How to identify the pattern? 

It is comparatively easy to identify Hanging Man. As we have discussed earlier, it has a small body and a long lower shadow. And the shadow, as the name “Hanging Man” suggests, hangs completely below the body. It appears on the uptrend and usually, it breaks a most recent high or it is very close to a recent high. Another important hint is that its top meeting a resistance area. 

Hanging man candlestick pattern

What does the Hanging Man candlestick pattern tell traders? 

It tells to the traders through visual evidence that the buyers are failing to keep the prices high. It acts as a warning that buyers are losing the battle. Even if buyers are somehow able to keep the prices high, large sell-off continues to drag prices lower. Hence, the Hanging Man candlestick pattern tells the traders about the first phase of selling pressure during an uptrend. However, on many occasions, it can also indicate a warning sign for current long positions. 

How to trade when you see the Hanging Man candlestick pattern? 

Traders can take full advantage of the Hanging Man pattern. Once you have the evidence that tells the trend is close to the end, you should look at those levels where you may close your trade. On the contrary, when the uptrend is about to end and there is evidence of a potential reversal, it is the best opportunity to make profits. Moreover, as per your trading strategy, you may also consider incorporating the Hanging Man pattern as a sell signal. 

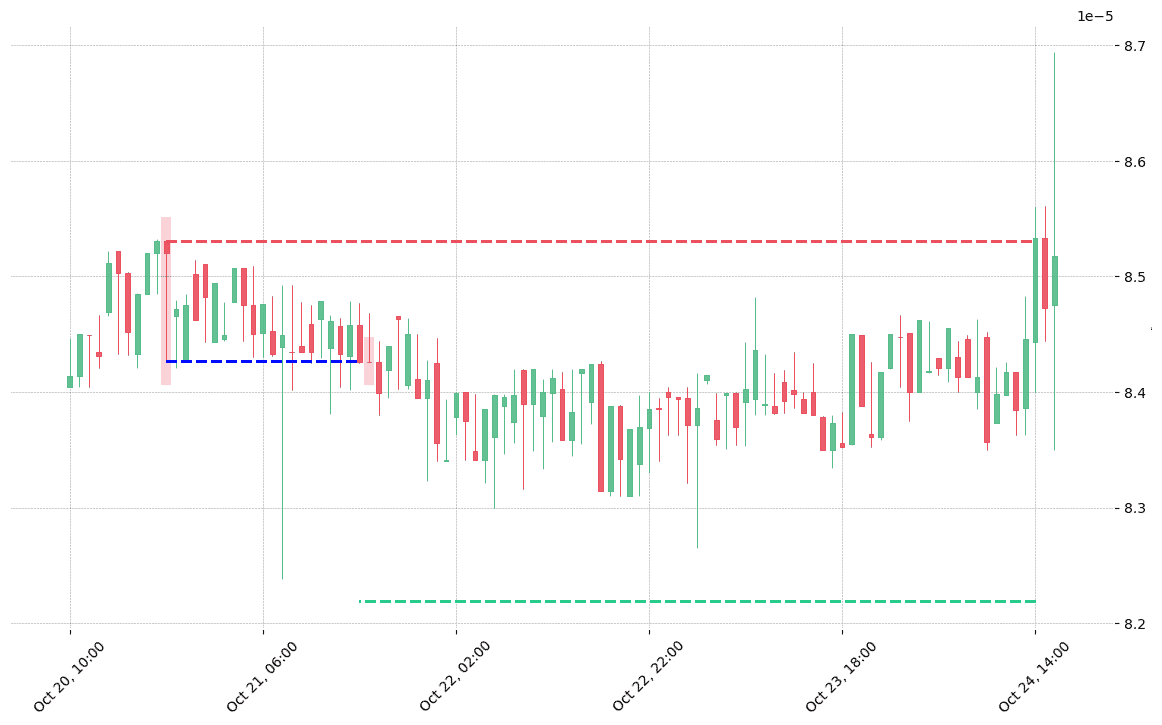
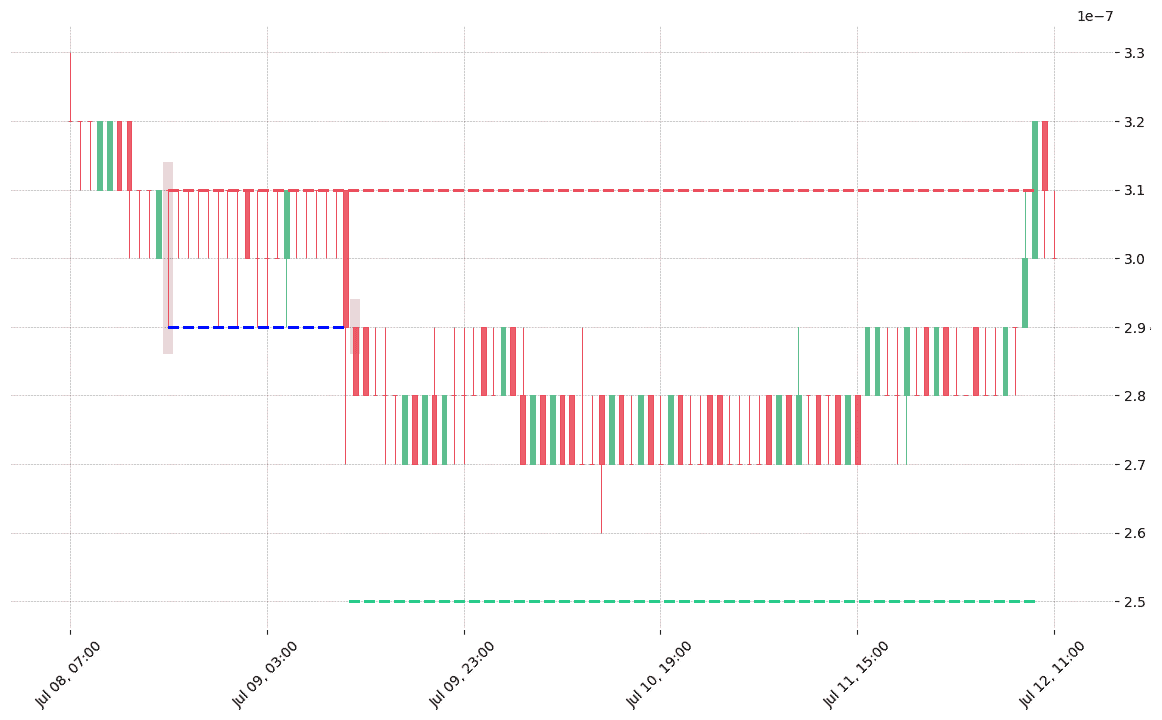
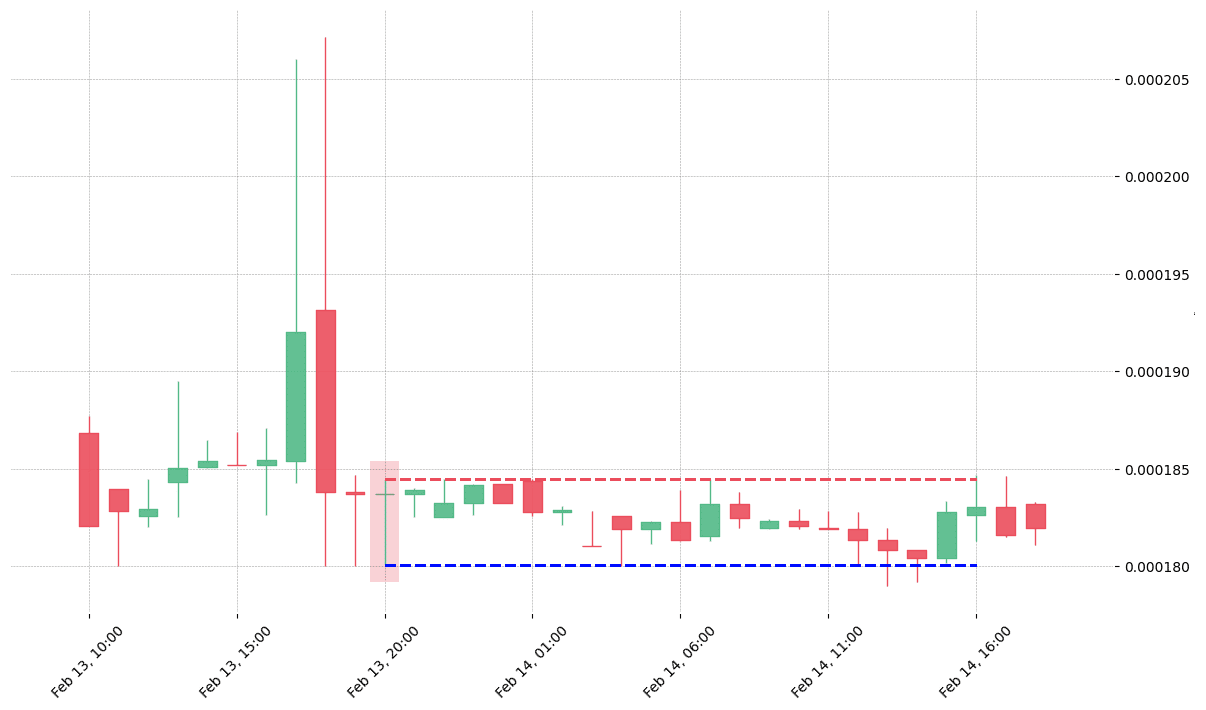
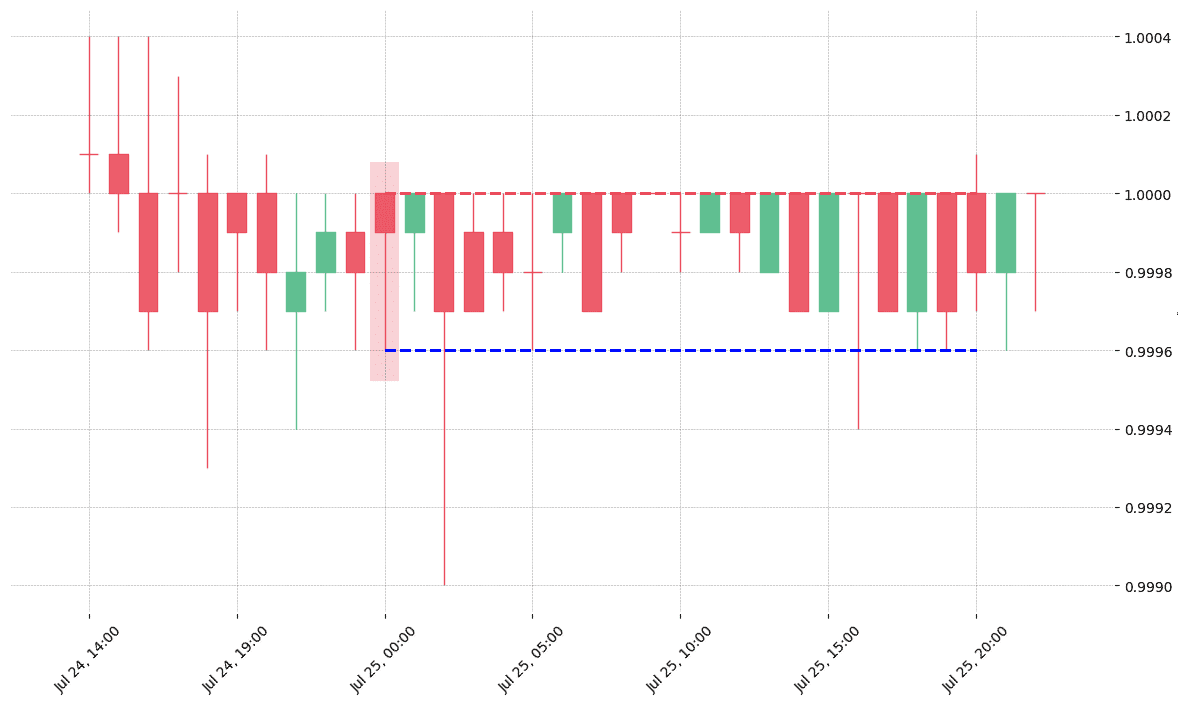
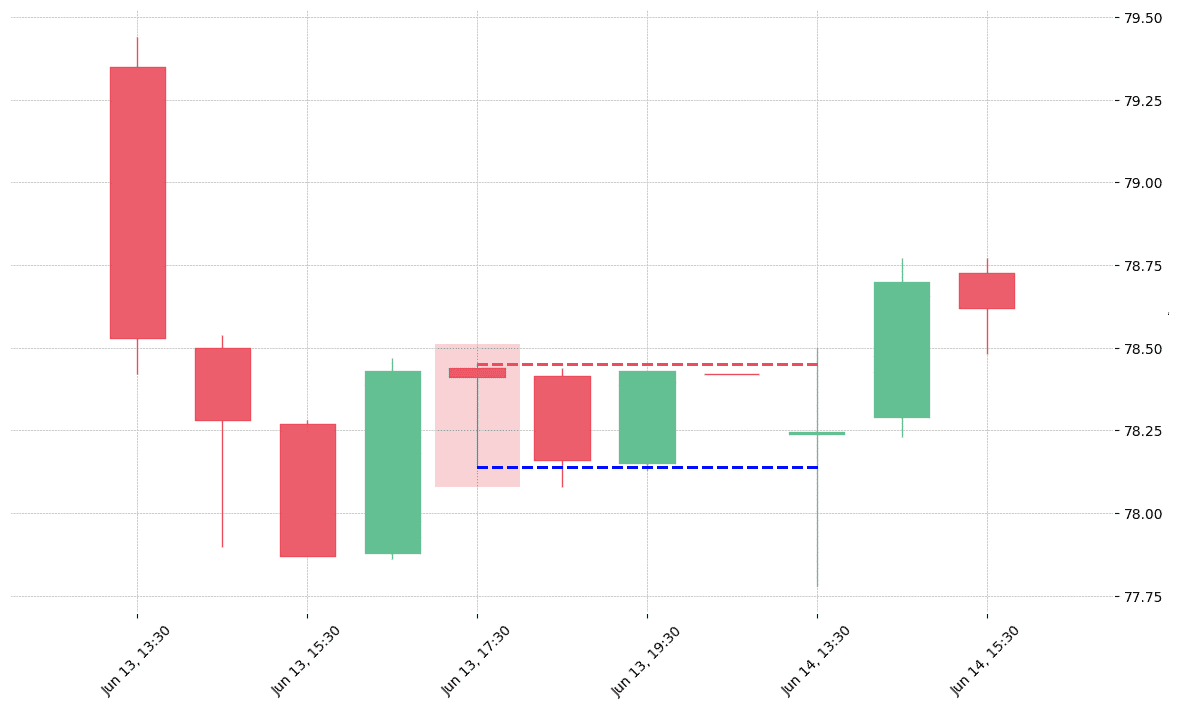
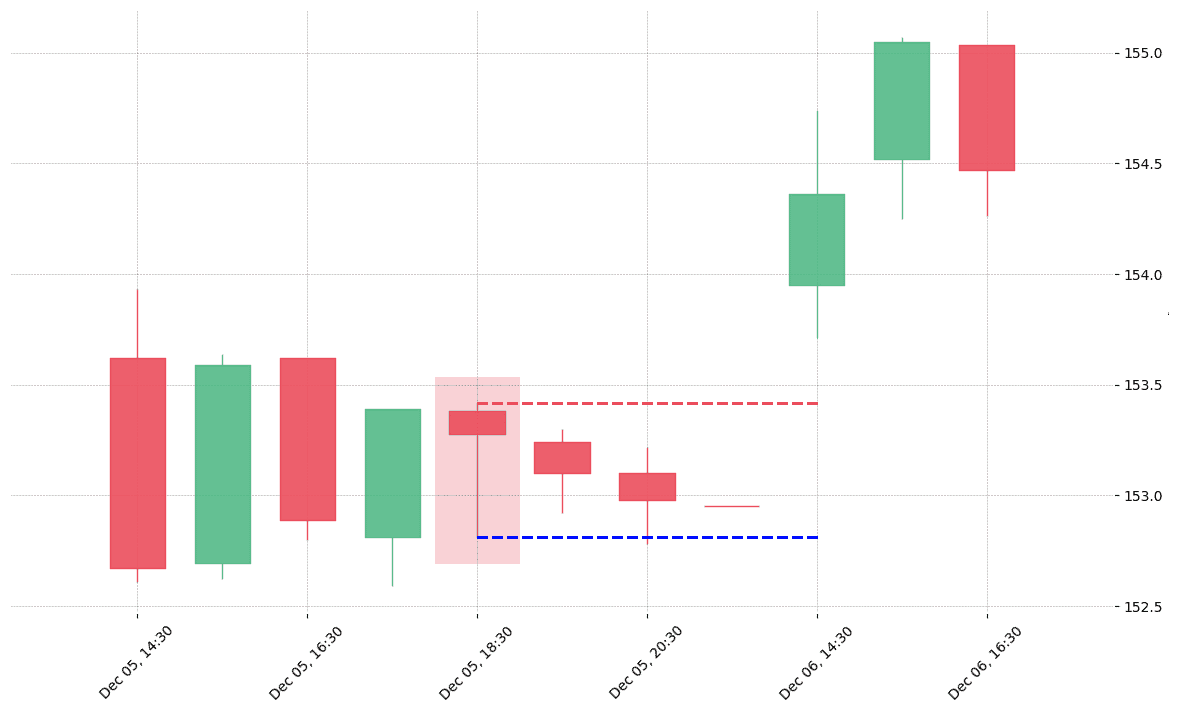
Hanging Man pattern look in real life

The cryptocurrency pair GRS/BTC printed a bearish Hanging Man on 2018-10-20 20:00:00. It confirmed on 2018-10-21 16:00:00 (meaning price closed below entry level). It retested the trade entry level on 2018-10-21 17:00:00. Then it failed to reach the 2:1 R/R target and got stopped on 2018-10-24 14:00:00.
The cryptocurrency pair TNB/BTC printed a bearish Hanging Man on 2020-07-08 17:00:00. It confirmed on 2020-07-09 11:00:00 (meaning price closed below entry level). It retested the trade entry level on 2020-07-09 12:00:00. Then it failed to reach the 2:1 R/R target and got stopped on 2020-07-12 09:00:00.
The cryptocurrency pair ICN/BTC printed a bearish Hanging Man on 2018-02-13 20:00:00. Unfortunately it invalidated on 2018-02-14 16:00:00 before the trade could trigger (it triggered the stop before entering).
The cryptocurrency pair USDC/USD printed a bearish Hanging Man on 2020-07-25. Unfortunately it invalidated on 2020-07-25 20:00:00 before the trade could trigger (it triggered the stop before entering).
The stock LDOS printed a bearish Hanging Man on 2019-06-13 17:30:00. Unfortunately it invalidated on 2019-06-14 13:30:00 before the trade could trigger (it triggered the stop before entering).
The stock STE printed a bearish Hanging Man on 2019-12-05 18:30:00. Unfortunately it invalidated on 2019-12-06 14:30:00 before the trade could trigger (it triggered the stop before entering).

Posted

in

by

Tags:

Comments

Leave a Reply

Your email address will not be published. Required fields are marked *