
What does the Hammer candlestick pattern mean?
Hammer is a bullish candlestick pattern that means the rejection of the lower prices. When the market opens, the prices begin to fall because the sellers take control. When the selling pressure is at the peak, a buying pressure intervenes and pushes the prices high. This buying pressure indicated by the Hammer strongly drives the closing prices above the opening prices.
How to identify it?
The identification of a Hammer candlestick pattern is easy because of its unique shape. There are specific conditions that must be there for a candle to be a Hammer candlestick.
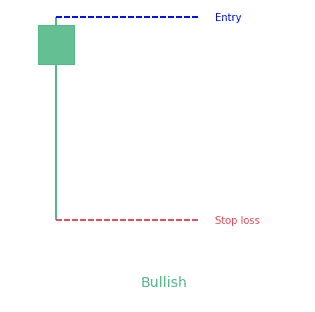
- The long lower wick that is at least twice the size of the body
- A tiny body that lies at the upper end of the trading range
- The very small or non-existent upper wick
What does the Hammer pattern tell traders?
Hammer candlestick pattern tells traders that a reversal in prices is about to happen after the determination of the bottom by the market. It indicates that the selling pressure will be overcome by the bulls and the prices will begin to rise again. However, it is important to notice that Hammer candlestick does not indicate the reversal of downtrend to upwards until the confirmation.
How to trade when you see the pattern?
Hammer pattern isn’t used in isolation, ever after the confirmation by the hammer. Traders use it for analysis of the trend of the market. It is always the best strategy to trade within the context of the market instead of trading any single candlestick pattern. It is advised by the experts to trade in the direction of the trend. Secondly, trading from an area of value is advantageous. Lastly, it is important for your success to identify an entry trigger to initiate your trading.
Difference between the Hammer candlestick pattern and the Hanging Man candlestick pattern
The Hammer is very similar to the Hanging Man candlestick pattern. Both have similar shapes with a small body, tiny or absent upper wick, and a long lower wick. The only difference between them is the nature of trends in which they appear. If a pattern appears in an upward trend and indicates a bearish reversal, it is Hanging Man. Conversely, if a pattern appears in a downtrend indicating a bullish reversal, it is a Hammer candlestick pattern.
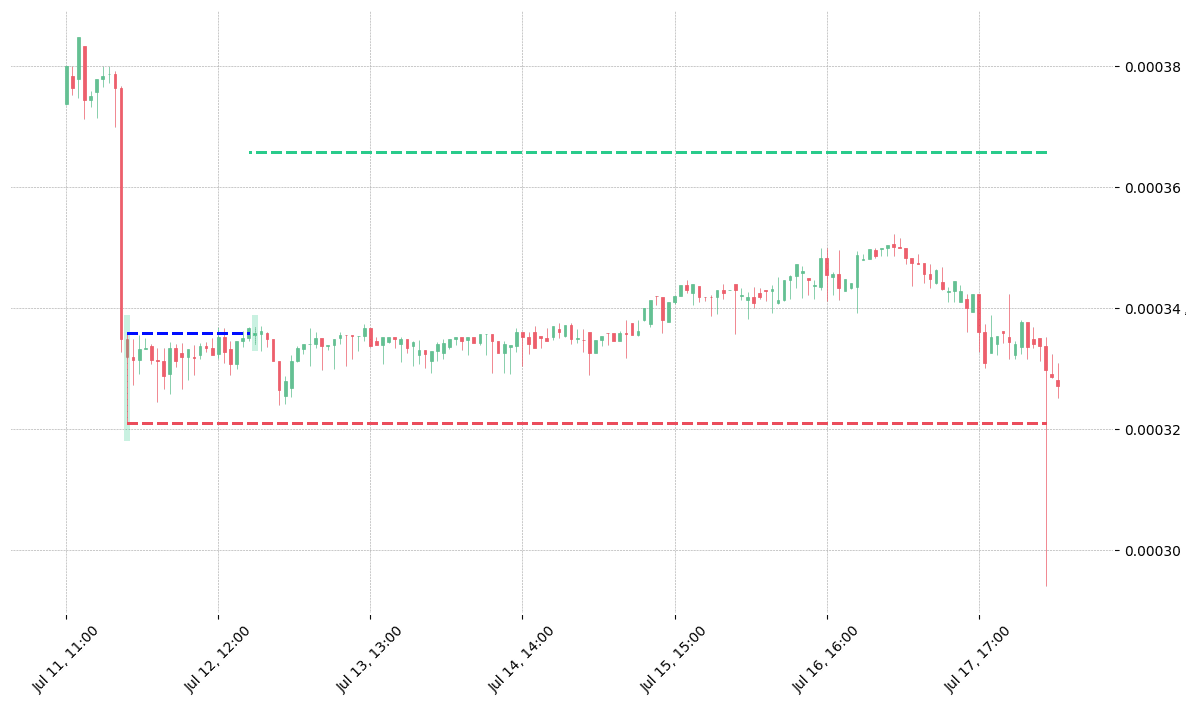
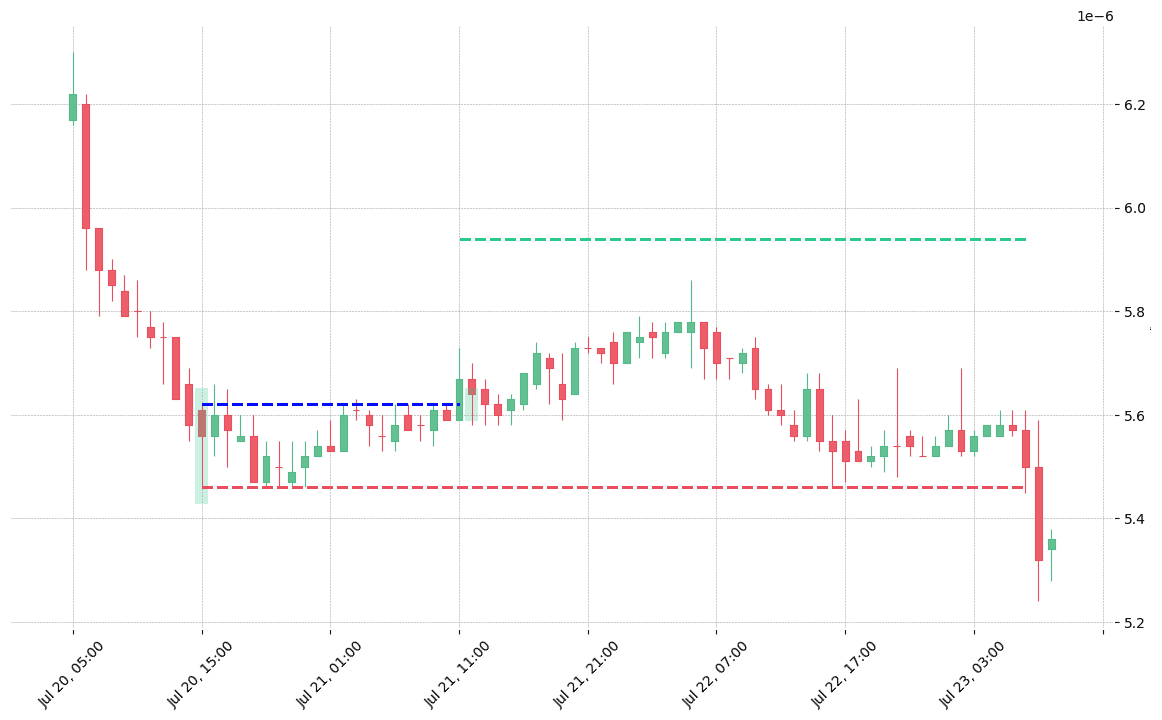
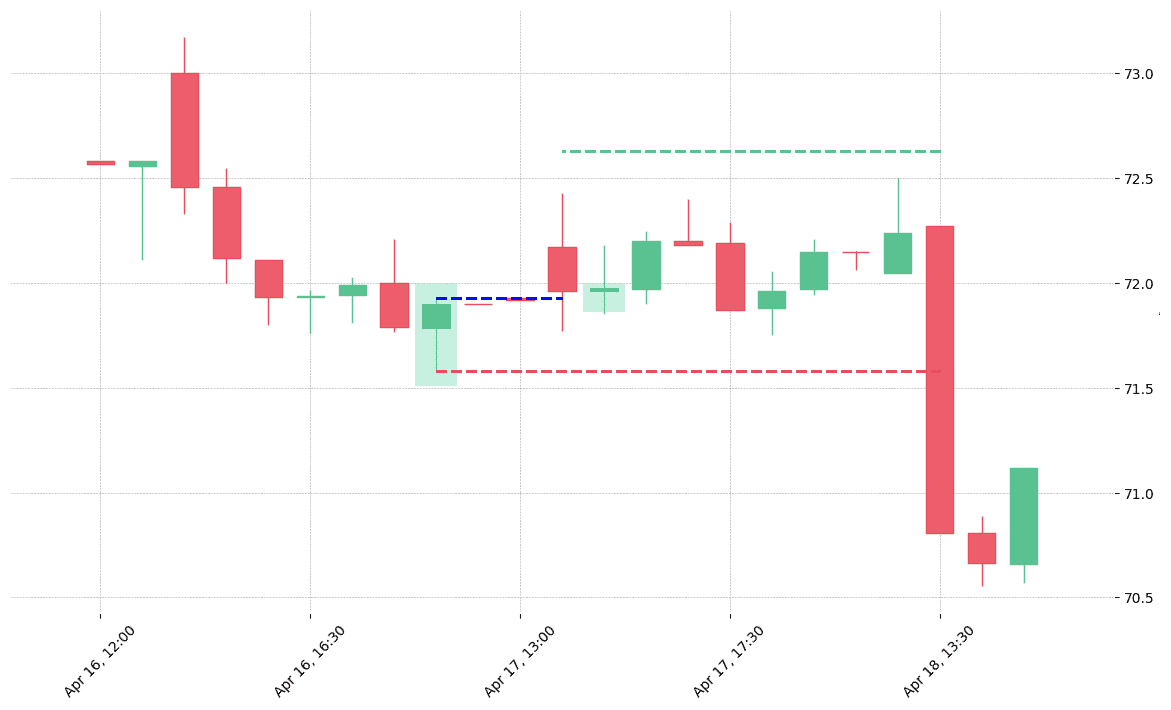
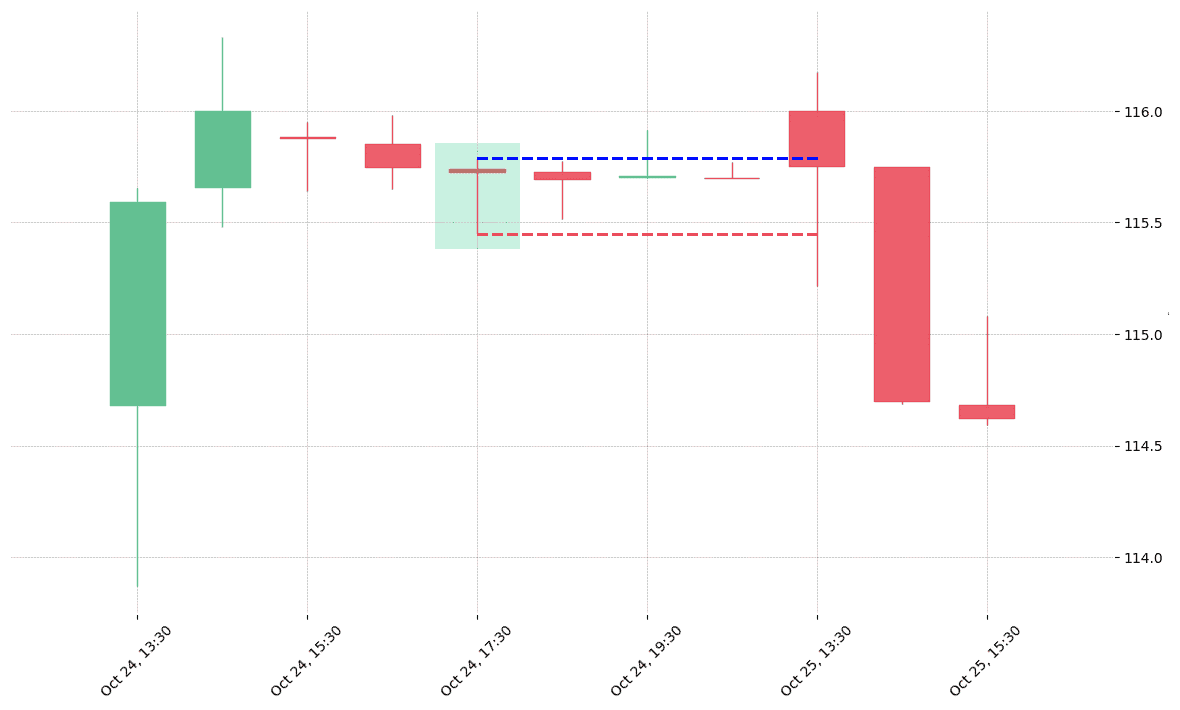
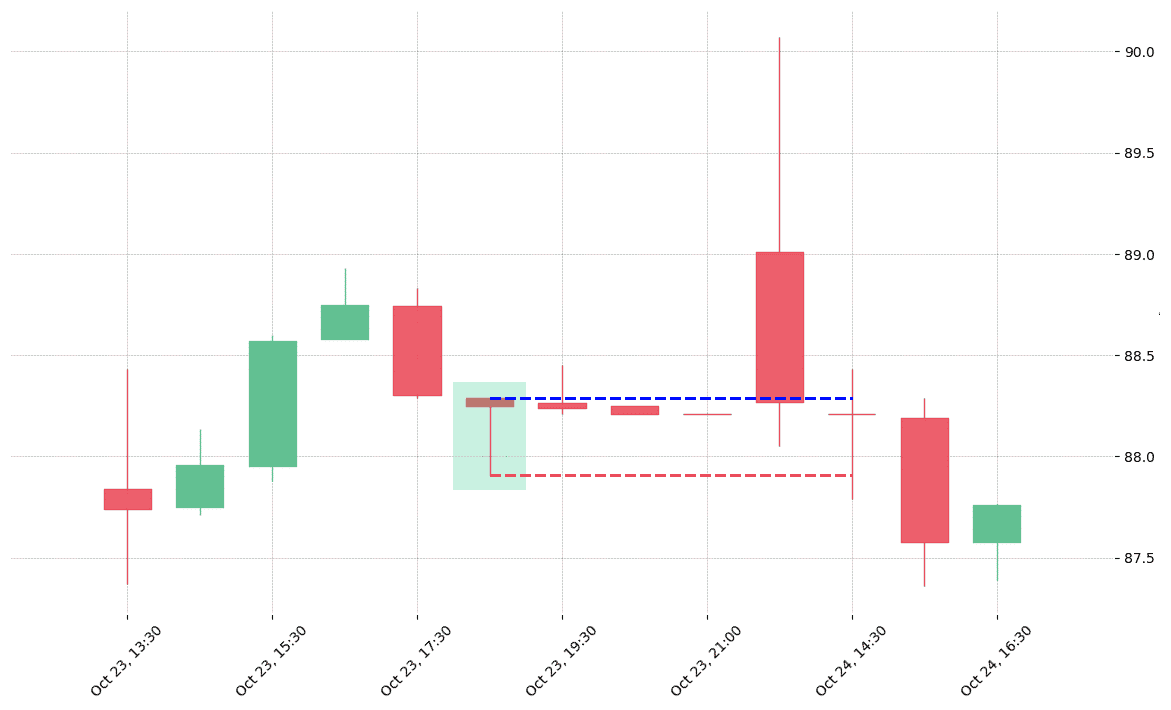
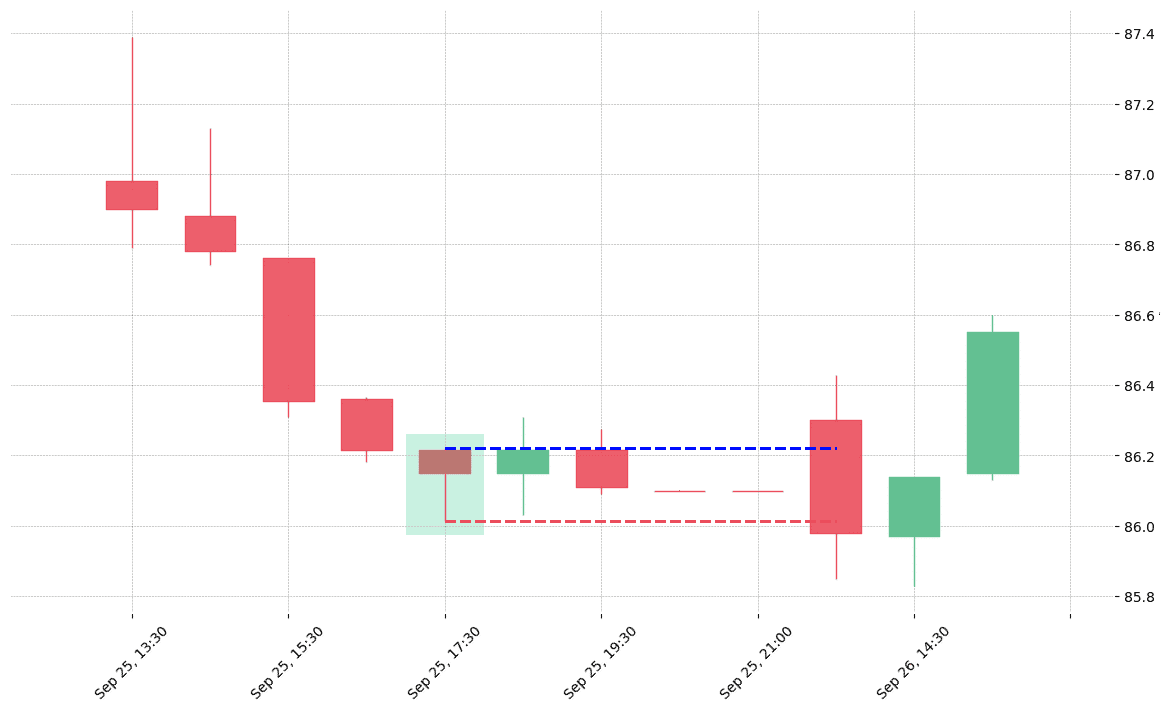
How does the Hammer pattern look in real life?

Leave a Reply