Effective temperature (ET) is defined as the temperature of saturated air (RH = 100%) at which the human beings would experience the same feeling of comfort as experienced in the actual unsaturated environment. It may also be defined as that index which correlates the combined effects of air temperature, relative humidity and air velocity on the human body.
Correspondingly, another effective temperature (ET*) can also be defined as the temperature at 50% RH at which the human body would experience exactly same feeling of comfort as at ET at 100% RH, and as experienced in the actual environment.
The effective temperature is defined to evaluate the combined effect of DBT, RH, and air velocity. The numerical value of effective temperature is made equal to the temperature of still (i.e. 5 to 8 m/min air velocity) saturated air, which produces the same sensation of warmth or coolness as produced under the given conditions.
1 Comfort Chart
The comfort chart is defined as that index which correlates the combined effects of air temperature, relative humidity and air velocity on the human body. The numerical value of effective temperature is made equal to the temperature of still (i.e. 5 to 8 m/min air velocity) saturated air, which produces the same sensation of warmth or coolness as produced under the given conditions.
The comfort chart, shown in Fig. 20.26, represents the concept of effective temperature in the comfort chart, DBT is taken as the abscissa and WBT as ordinates. The RH lines are replotted from the psychrometric chart. The statistically prepared graphs corresponding to summer and winter season are also superimposed. These graphs have effective temperature scale as abscissa and percentage of people feeling comfortable as ordinate.
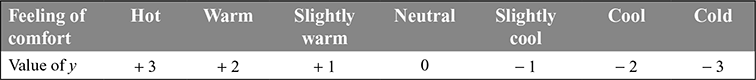
There is a correlation between comfort level, temperature, humidity sex, length of exposure, etc. According to ASHRAE (American Society for Heating, Refrigeration, and Air conditioning Engineering) thermal sensation scale for exposure for a period of one hour, the value of index y for comfort for men, women and both sexes separately are expressed as follows


where td = DBT, °C
pv = vapour pressure, kPa
The values for feeling of comfort of y are as follows:
The comfort chart shown in Fig. 20.26 represent the range for both summer and winter conditions within which a condition of comfort exists for most people. The general practice is to recommend the following optimum inside design conditions for comfort:
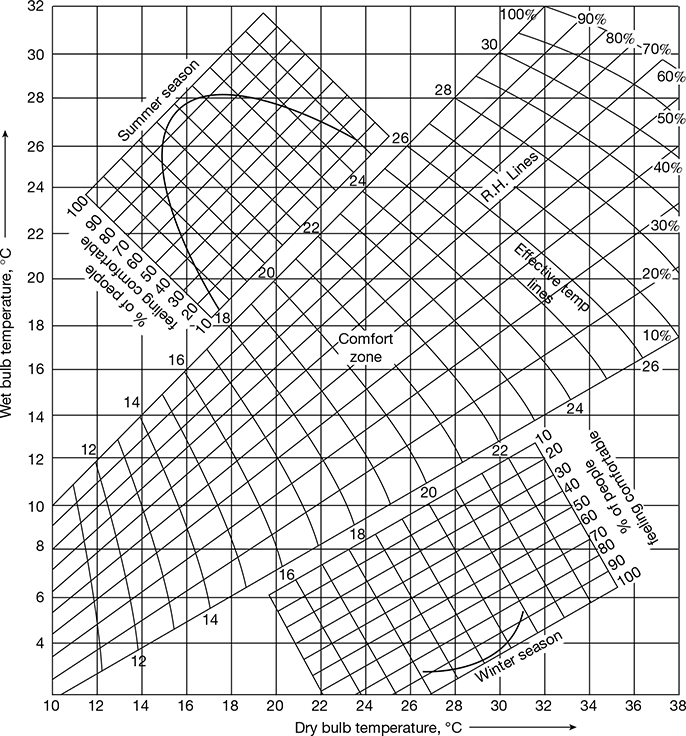
Figure 20.26 Comfort chart for still air (air velocities from 5 to 8 m/min)
| Summer air-conditioning: | Winter air-conditioning: |
|---|---|
| ET = 22°C | ET = 19°C |
| DBT = 25° ± 1°C | DBT = 21°C |
| RH = 50 ± 5% | RH = 50% |
| Room air velocity = 0.4 m/s | Room air velocity = 0.15 − 0.20 m/s |
The comfort chart does not take into account the variations in comfort conditions when there are wide variations in the mean radiant temperature. The comfort chart shown in Fig. 20.27 has become obsolete due to its shortcomings of over exaggeration of humidity at lower temperature and under estimation of humidity at heat tolerance level. The modified comfort chart shown in Fig. 20.27 is commonly used now.
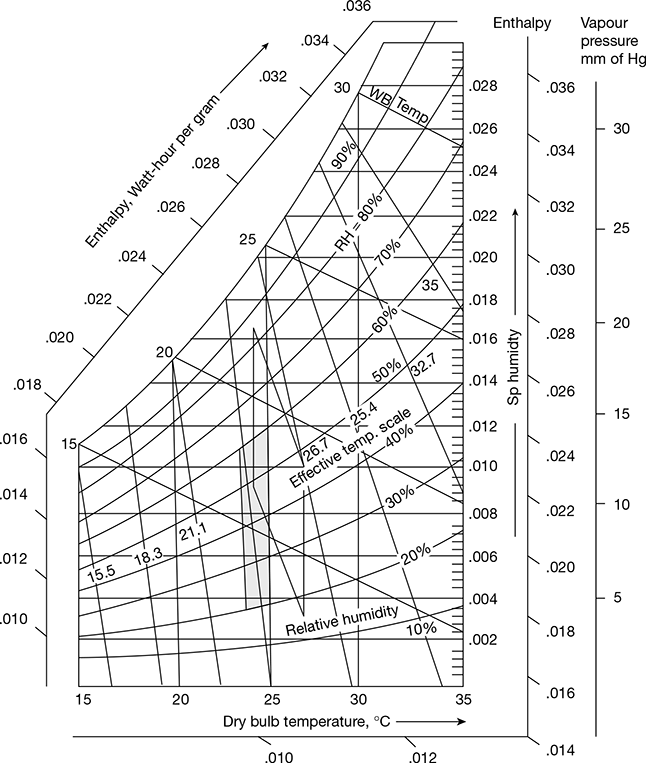
Figure 20.27 Modified comfort chart
2 Factors Affecting Optimum Effective Temperature
The factors affecting optimum effective temperature are:
- Climate and seasonal differences: The ET changes with season. During summer it is 22°C and during winter 19°C.
- Clothing: Persons with light clothings need lower optimum ET than a person with heavy clothings.
- Age and sex: Women require higher ET (about 0.5°C) than men. Children also need higher ET than adults.
- Duration of stay: For shorter stay, higher ET is required than that needed for longer stay.
- Kind of activity: Low ET is required for people doing heavy activity, like factory workers, dancers, etc.
- Density of occupants: Lower ET is needed when density of persons in a place is high.
Leave a Reply