Definition
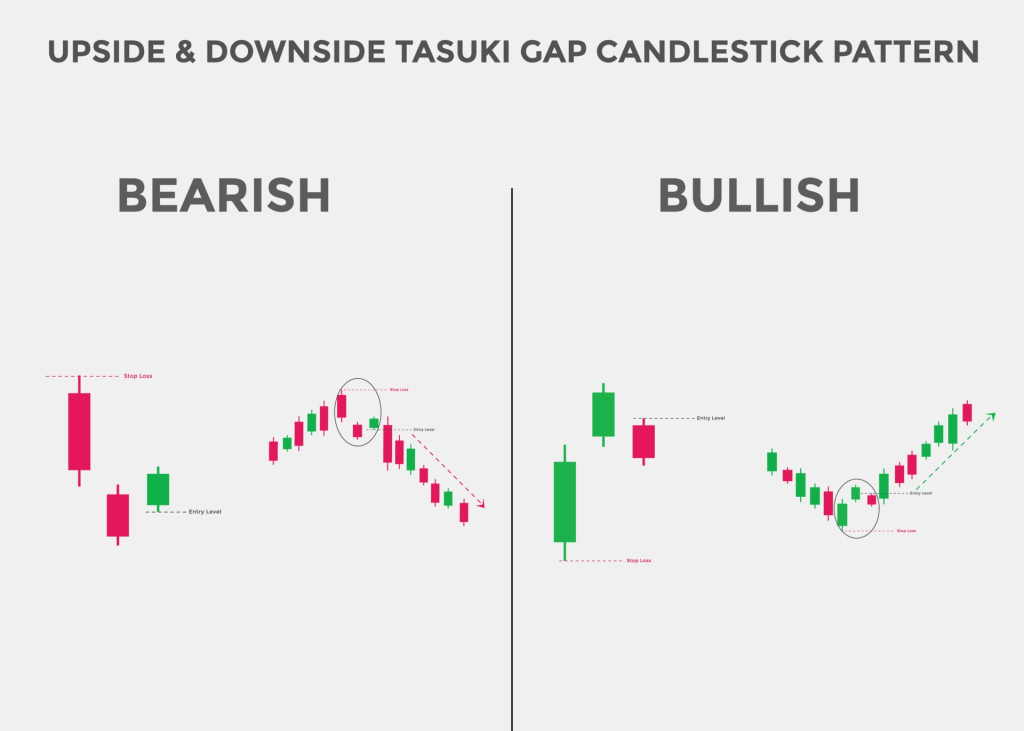
The Downside Tasuki gap is a continuation candlestick pattern that consists of three candlesticks with a downside gap. The downside gap will form within two bearish candlesticks.
It is a bearish trend continuation pattern representing the seller is in control. This pattern will usually form within a bearish trend. The continuation signal is the best signal for intraday traders to keep holding sell positions.
it is the opposite pattern to the upside Tasuki gap.
How to identify the Downside Tasuki Gap candlestick?
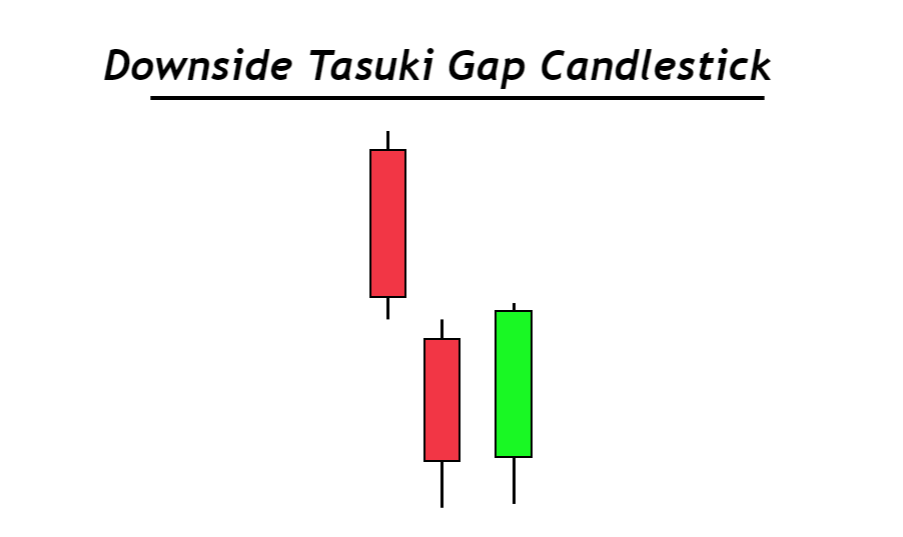
To find a Tasuki gap candlestick on the price chart, follow the following steps
- The first candlestick should be a significant bearish candlestick that indicates the high momentum of sellers in the market.
- The second candlestick should open with a gap down, making a lower low. It will be a bearish candlestick, and the opening price should always be below the low of the first candlestick.
- The third candlestick will open within the range of the second candlestick, and it should close below the closing price of the first candlestick. It will be a bullish candlestick.
These are the simple criteria to find the downside Tasuki gap on the chart.
Downside Tasuki gap: Information Table
| Features | Explanation |
|---|---|
| Number of Candlesticks | 3 |
| Prediction | Bearish trend continuation |
| Prior Trend | Bearish trend |
| Counter Pattern | Upside Tasuki gap |
The psychology behind the downside Tasuki gap pattern
When you read the price action behind this Tasulki gap pattern, you will know the activity of traders trading behind the chart.
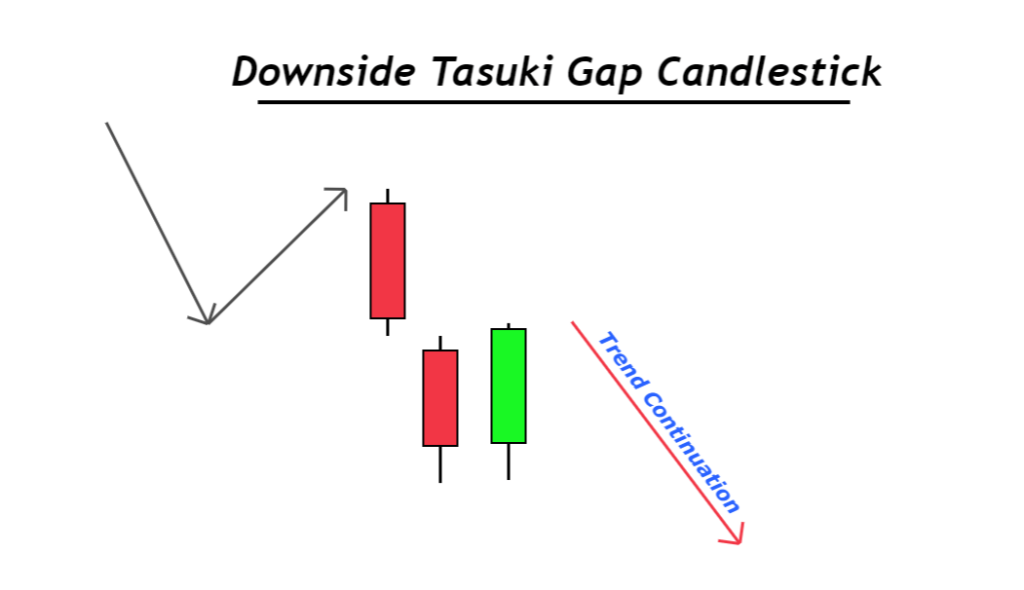
The downside Tasuki gap pattern consists of two market patterns. The first is a bearish impulsive wave, and the second is a bullish price retracement. It is a bearish continuation pattern of supply and demand. It will form a drop base drop pattern
The two bearish candlesticks with a gap represent that the sellers are in complete control, continuously decreasing the price value. The primary trend is bearish, forming lower lows and lower highs. It is a bearish impulsive wave.
After this wave, a bullish retracement wave will start. During this session, buyers will try their best to increase the price, but they will fail, and the candlestick will close below the closing price of the first candlestick. Simply means, buyers fail to breach the resistance level created by sellers.
Pro Tip: A higher timeframe candlestick’s closing and the opening price will be the support and resistance levels on lower timeframes.
Leave a Reply