Bullish Doji Star candlestick pattern
What is it?
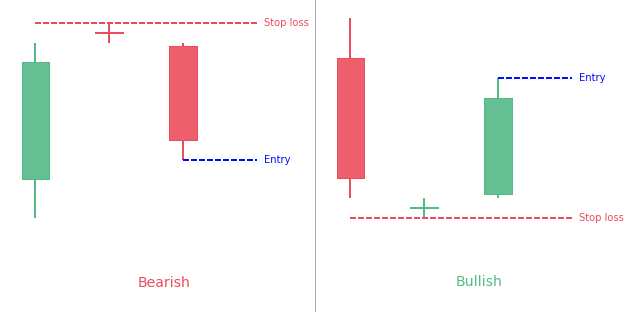
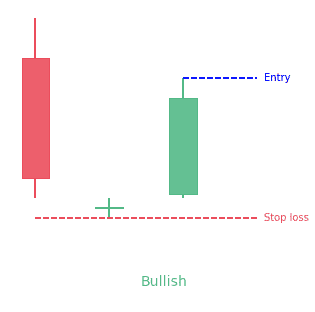
The bullish Doji Star pattern is a three-bar formation pattern that develops during a downtrend. The first bar has a long black body, the second bar opens even lower. It closes just like a Doji pattern with a small range of trading. The third bar closes above the midpoint.
Technical analysts use bullish Doji Star candlestick to determine the reversal of the long current downtrend in the market. The experts consider bullish Doji Star Patterns as signals to buy. They also use it to watch time to avoid selling the assets. It mostly appears at the bottom of the chart. This act as a bell to inform that arrival of the bulls is imminent after a long bearish phase.
How to identify the bullish Doji Star candlestick?
- Look for a normal red candlestick on the very bottom of the charts on the first day. If confirms the prevalent downtrend and also illustrates that price closed lesser than the opening price.
- Next, look for a small Doji on the second day showing that there is very minimal or no gap at all between opening and closing prices.
- Now look for the third candlestick showing a gap up opening.
How to trade the bullish Doji Star pattern?
You should think about initiating a trade on the long side while keeping a stop loss just to be at the safe side if prices start to move in the opposite direction. You may also try to check 5 minutes and 15 minutes timeframes to analyze this pattern and take your guards accordingly. After the formation of the bullish Doji Star pattern, prices begin to move up. Therefore, if you initiate trade after confirmation of this pattern, there are strong chances that you will be able to gain profit.
Bearish Doji Star candlestick pattern
What is it?
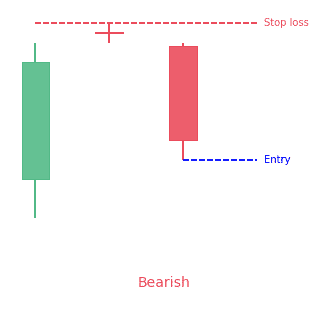
The bearish Doji Star candlestick is a bearish reversal pattern appearing during an uptrend. It is represented by two lines. The first candle has a long body due to increase during an uptrend. Afterward, a Doji is formed that particularly opens and closes above the first candle.
How to identify a bearish Doji Star candlestick?
You should look for a candlestick with a long white line and a Doji that is above that first candle. You should also remember that the shadow of the Doji will not be too long and the shadows of the line do not overlap. Hence, these hints make it easy to identify a bearish Doji Star candlestick pattern.
How to trade a bearish Doji Star pattern?
A bearish Doji Star is a signal that shows the end of an uptrend and start of a bearish reversal leading to decreasing the prices. Therefore, it is a wise move to sell the stock whenever a bearish Doji Star pattern appears.
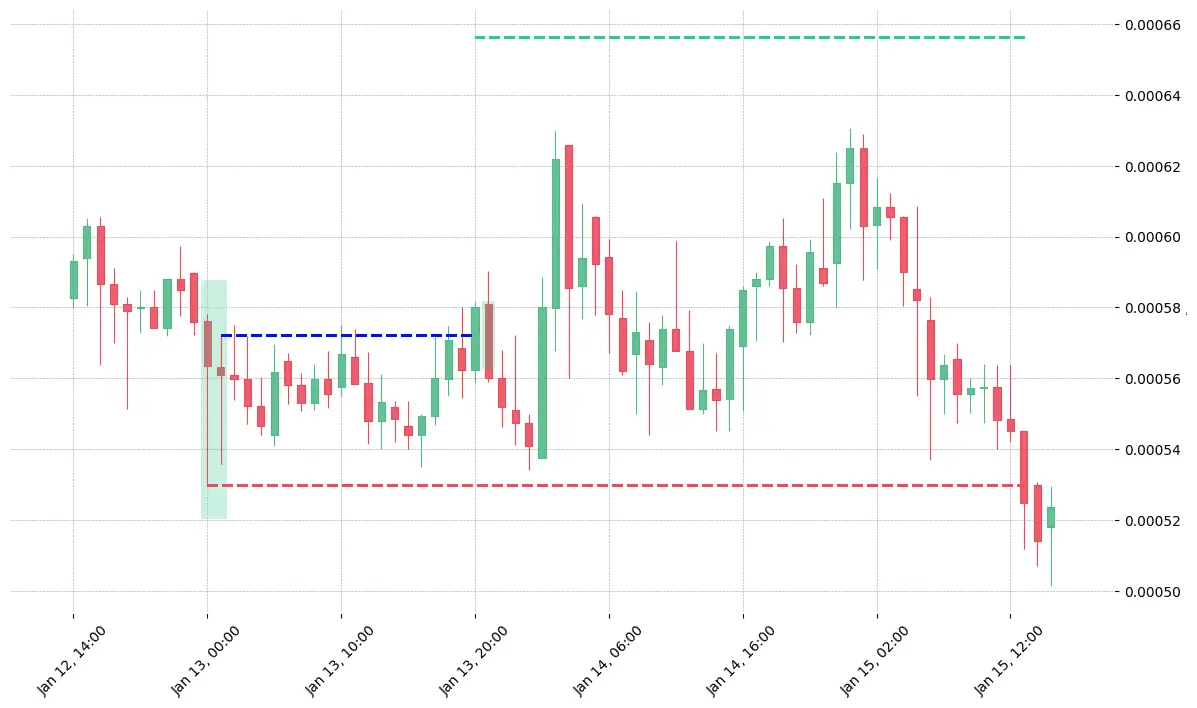
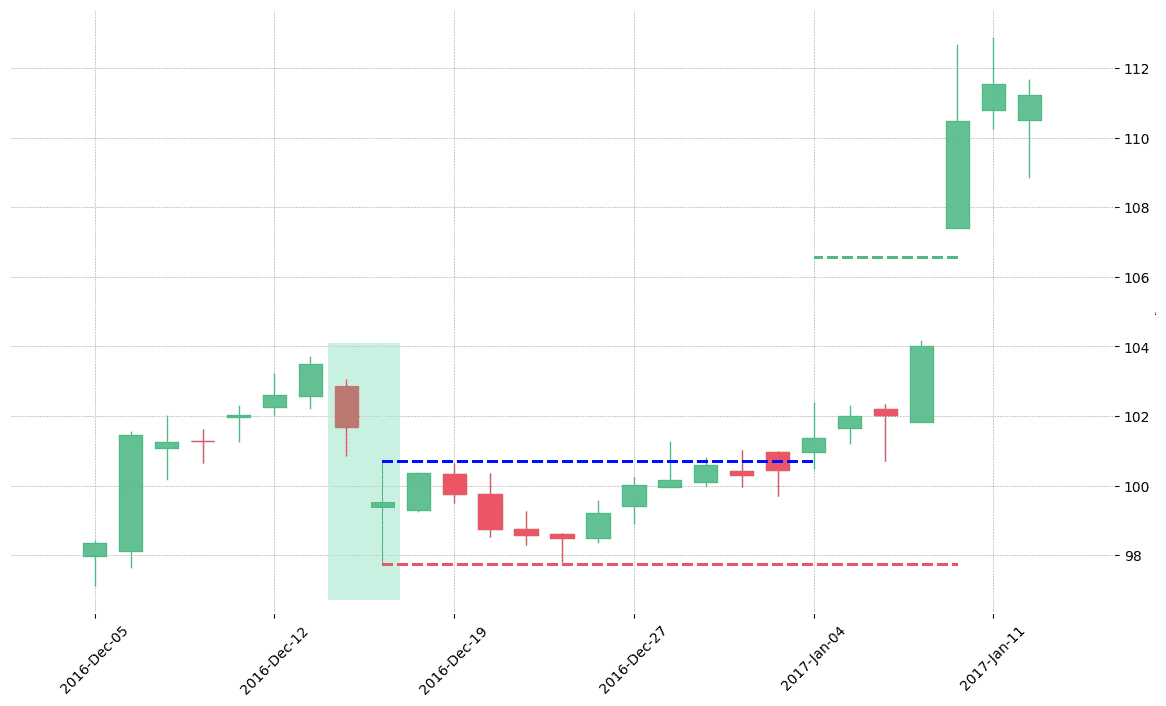
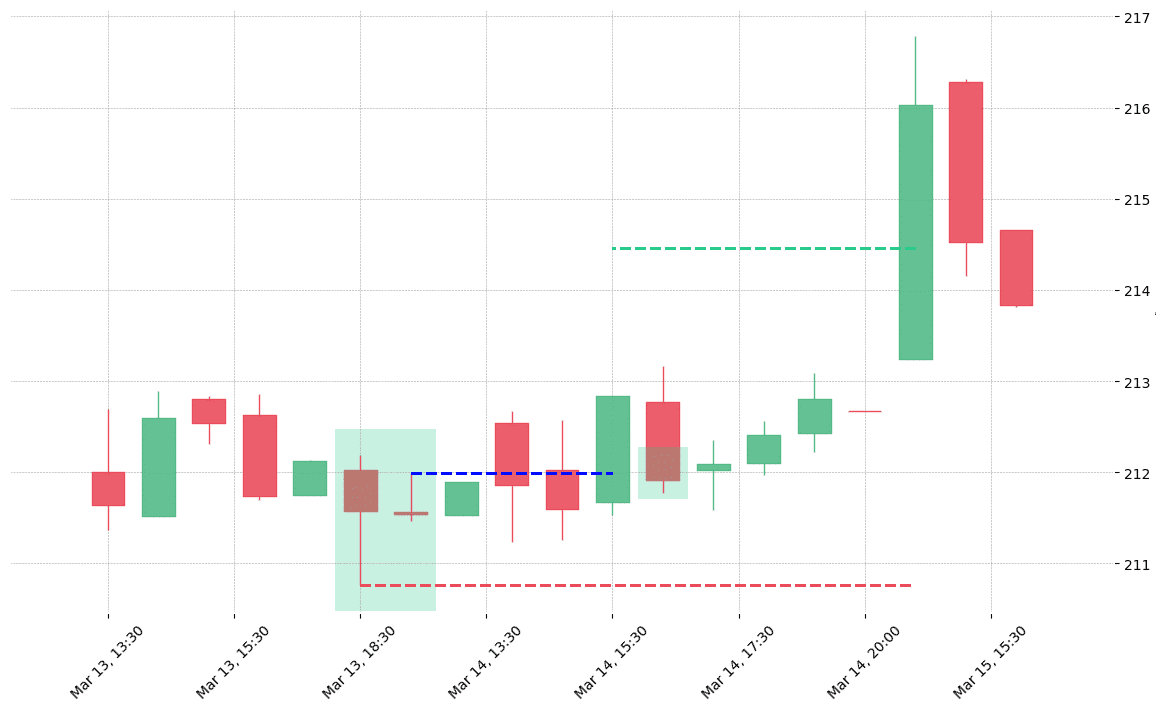
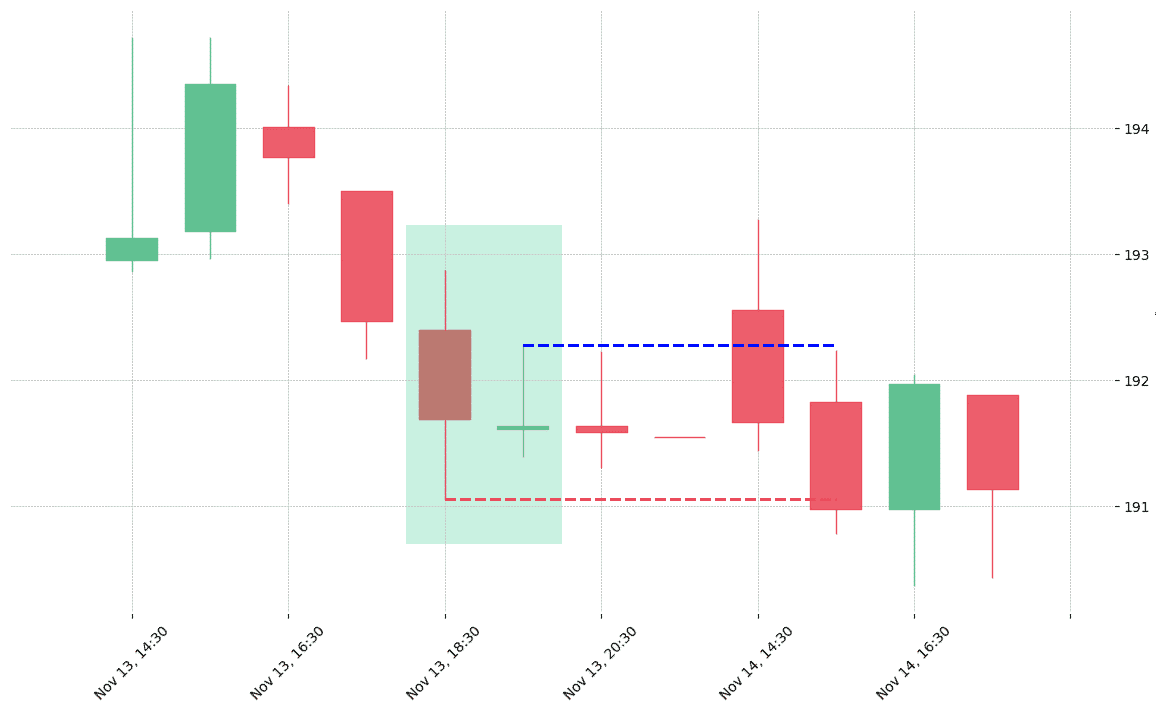
Doji Star pattern look in real life

Leave a Reply