What is Doji candlestick pattern?
The Doji candlestick pattern can lead to high profits in trading.
The versatility of this candlestick pattern is appreciated by all types of traders for different time frames.
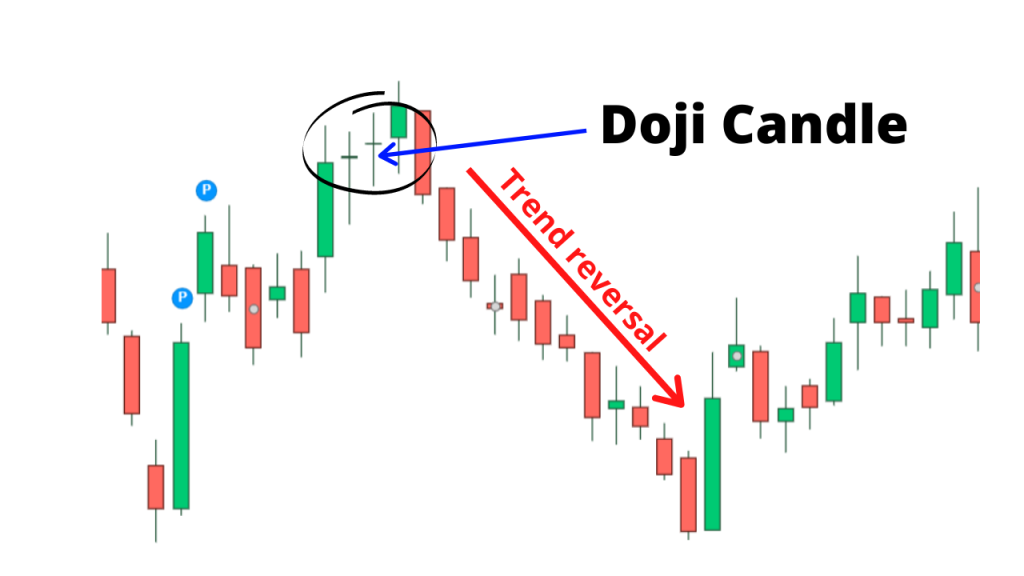
The Doji candlestick pattern is a formation that occurs when a market’s open price and close price are almost exactly the same.
How is a Doji candlestick Pattern formed?
This doji candlestick is formed when the market opens, and bullish traders push prices up, whereas bearish traders reject the higher price and push it back down.
It could also be that bearish traders try to push prices as low as possible, and the bulls fight back and push the price up.
The upward and downward movements that happen between open and close form the wick.
The body is formed when the price closes at or almost the same level as it opened.
What does a Doji tell traders?
When looked at in isolation, a Doji candlestick pattern indicates that neither the buyers nor sellers are gaining – it’s a sign of indecision.
Whereas some traders believe that the Doji candlestick pattern indicates an upcoming price reversal when viewed alongside other candlestick patterns, but this may not always be the case.
It could indicate that buyers or sellers are gaining momentum for the continuation of the ongoing trend.
It’s important to remember that the Doji candlestick pattern does not provide as much information as one would need to make a decision.
Types of Doji Candlestick Pattern:
There are different types of Doji candlestick patterns, namely the Common Doji, Gravestone Doji, Dragonfly Doji and Long-Legged Doji.
Let us discuss about them:
1. Neutral Doji
This is the most common type of Doji candlestick pattern.
When buying and selling are almost the same, this pattern occurs.
The future direction of the trend is uncertain as indicated by this Doji pattern.
2. Long-Legged Doji
As the name suggests this is a long-legged candlestick pattern.
When the supply and demand factors are at equilibrium, then this pattern occurs. The trend’s future direction is regulated by the prior trend and Doji pattern.
3. Gravestone Doji
This pattern is found at the end of the uptrend when supply and demand factors are equal.
At the day’s low, the candlestick opens and closes. The prior trend and Doji pattern regulate the future direction of the trend.
4. Dragonfly Doji
This pattern appears at the end of the downtrend when the supply and demand factors are at equilibrium.
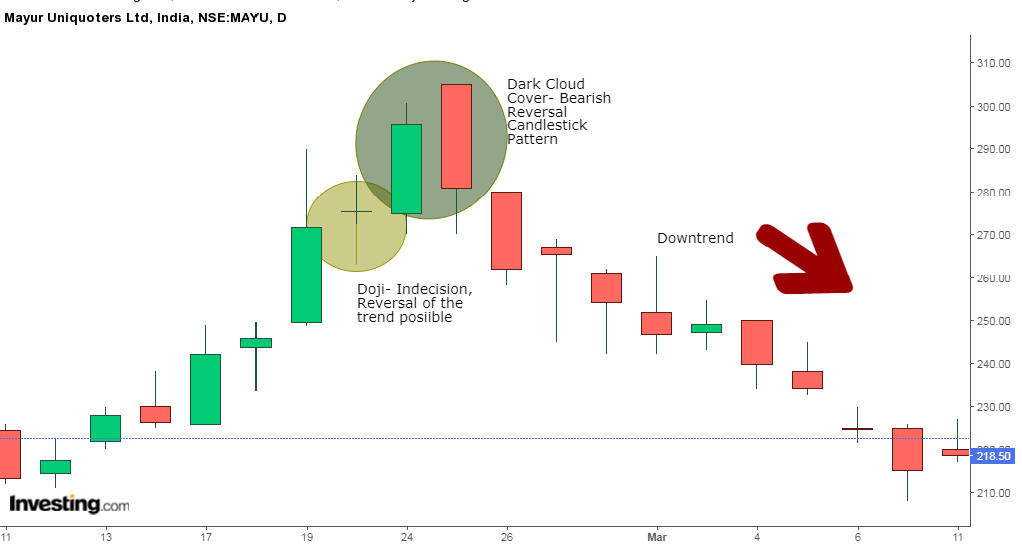
Doji Example:
In the below chart of Mayur Uniquoters Ltd, we can see that at the end of the uptrend, a Doji candle is formed, indicating that the ongoing trend has become certain.
The Doji is then followed by the Dark Cloud Cover candlestick pattern that confirms that the reversal is going to take place, as shown below:
What is the Difference between a Doji and a Spinning Top?
The spinning top is quite similar to doji candlestick pattern, but its body is larger when compared to Doji.
A candle’s real body generally represent up to 5% of the size of the entire candle’s range to be a Doji candlestick pattern.
Any more than that, it becomes a spinning top. A spinning top candlestick also signals weakness in the current trend.
If either a Doji or spinning top is spotted, then traders should look to other indicators, such as Bollinger Bands, for determining the context to decide if they indicate trend continuation or reversal.
How to use Doji Candlestick Scans in StockEdge:
You can also use the Doji Candlestick pattern scans in StockEdge web version:
Steps to use Doji Candlestick scans in StockEdge:
- Under the “Candlestick Scans” we can see Neutral Scans as shown below:
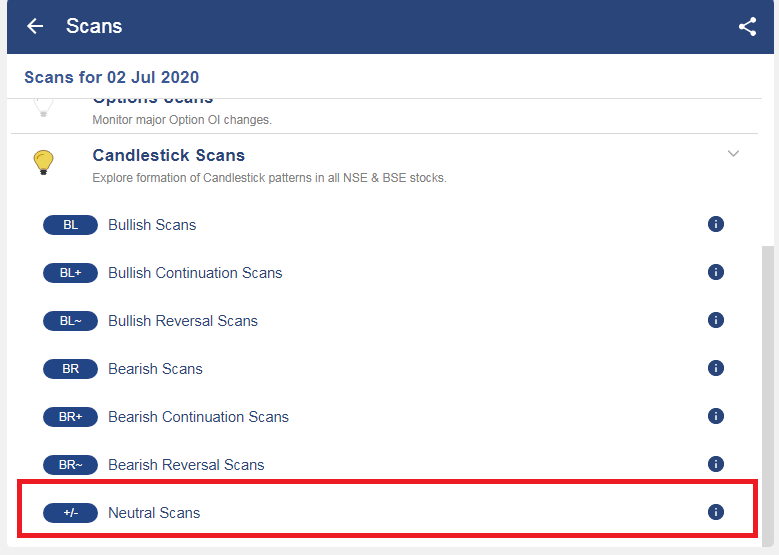
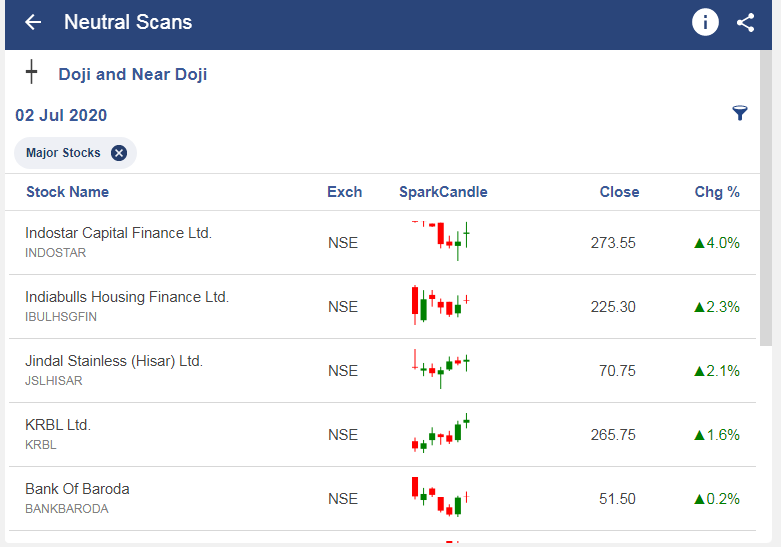
- When we click on the “Neutral Scans” we can see “Doji” scan, click on that:

- After selecting on it, you will get a list of stocks in which “Doji” pattern is formed as shown below:
Limitations of a Doji:
In isolation, a Doji candlestick acts as a neutral indicator and provides little information.
Moreover, a Doji is not commonly formed, thus it is not a reliable tool for spotting things like price reversals.
When it does occur, it isn’t always reliable either. There is no guarantee that the price will continue in the expected direction following the confirmation candle.
It is also difficult to estimate the potential reward of a Doji.
Other technical techniques, like other candlestick patterns, technical analysis indicators, or strategies should be used with this candlestick pattern for making trading decisions.
Key Takeaways:
- A Doji is a candlestick pattern that looks like a cross as the opening price and the closing prices are equal or almost the same.
- When looked at in isolation, a Doji indicates that neither the buyers nor sellers are gaining – it’s a sign of indecision.
- There are different types of Doji candlestick patterns, namely the Common Doji, Gravestone Doji, Dragonfly Doji, and Long-Legged Doji.
- Before acting on any signals, including the Doji candlestick chart pattern, one should always consider other patterns and indicators.
Leave a Reply