THE ENGULFING CANDLESTICK PATTERNS
The Engulfing bar is formed when it fully engulfs the previous candle. The engulfing bar can engulf more than one previous candle, but to be considered an engulfing bar, at least one candle must be fully consumed.
The bearish engulfing is one of the most important candlestick patterns. This candlestick pattern is a combination of two of more candles where current candle must fully engulf at least one prior candle.
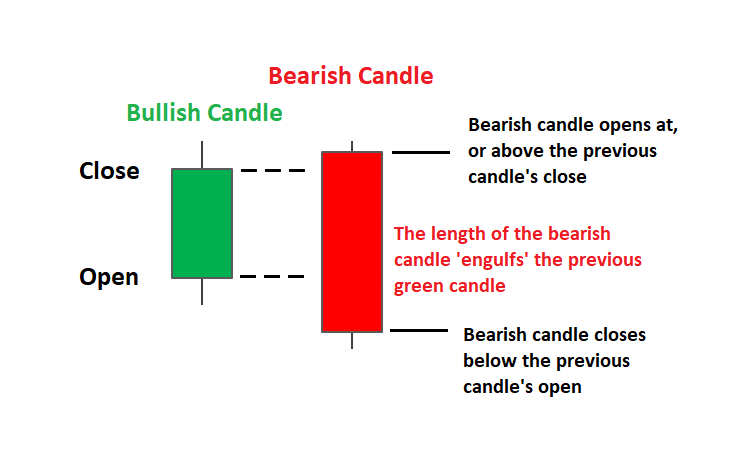
BEARISH ENGULFING PATTERN

Above image showing bearish engulfing pattern where larger body bearish red candle fully engulfing previous smaller body bullish green candle including wicks. After reading this candle pattern you will know the psychology of bulls and bears in the market.
Above bearish engulfing pattern showing that bears are controlling the market during this particular time frame. The timeframe could be 5 min, 15 min, 60 min, daily, weekly or monthly.
If this pattern occurs in the beginning or middle of the trend then it has less importance but if this pattern occurs at the peak after the strong uptrend then this pattern indicates that seller engulf all buyers indicating a trend reversal.

As you can see when this price action pattern occurs after an uptrend, we can anticipate a trend reversal because buyers are not still in control of the market, and sellers are trying to push the market to go down.
You can’t trade any bearish candlestick pattern you find on your chart; you must use other tools and theories to confirm trend before taking trade.
BULLISH ENGULFING PATTERN
The bullish engulfing is another most important candlestick patterns. This candlestick pattern is a combination of two of more candles where current bullish candle must fully engulf at least one prior bearish candle.

Bullish candlestick pattern if occurs after a downtrend then have higher importance. The bullish candlestick pattern indicates that market is no more in the grip of sellers and now buyers will take control of the market.
When bullish engulfing pattern occurs after strong downtrend then it indicates a powerful reversal but you need to use other tools and theories to confirm reversal before taking trade.
When a bullish engulfing candle forms in the context of an uptrend, it indicates a continuation signal. See below chart:

The above example shows us clearly how the market changes direction after the formation of a bullish engulfing bar pattern.
The smaller red body that represents the selling power was covered by the second larger green body that represents the buying power.
The color of the bodies is not important. What’s important is that the smaller one is totally engulfed by the second candlestick that means larger green candle may fully engulf previous smaller green candle or smaller red candle.
Don’t try to trade the market using this price action setup alone, because you will need other factors of confluence to decide whether the pattern is worth trading or not. We will cover in upcoming articles. Here we are trying to sharpen the skill to identify bullish/bearish engulfing on the charts.
Leave a Reply