Acoustical enclosures are used wherever containment or encapsulation of the source or receiver is a good, cost‐effective, feasible solution. They can be classified in four main types: (i) large loose‐fitting or room‐size enclosures in which complete machines or personnel are contained, (ii) small enclosures used to enclose small machines or parts of large machines, (iii) close‐fitting enclosures that follow the contours of a machine or a part, and (iv) wrapping or lagging materials often used to wrap pipes, ducts, or other systems.
The performance of such enclosures can be defined in three main ways [5]: (i) noise reduction (NR), the difference in sound pressure levels between the inside and outside of the enclosure, (ii) transmission loss (TL, or equivalently the sound reduction index), the difference between the incident and transmitted sound intensity levels for the enclosure wall, and (iii) insertion loss (IL), the difference in sound pressure levels at the receiver point without and with the enclosure wall in place. Enclosures can either be complete or partial (in which some walls are removed for convenience or accessibility). Penetrations are also often necessary to provide access or cooling.
9.6.1 Reverberant Sound Field Model for Enclosures
In the energy model for an enclosure it is assumed that the reverberant sound field produced within the enclosure is added to the direct sound field produced by the sound source being enclosed. The sum of the two sound fields gives the total sound field within the enclosure, which is responsible for the sound radiated by the enclosure walls.
If the smallest distance ℓ between the machine surface and the enclosure walls is greater than a wavelength λ (ℓ > λ), for the lowest frequency of the noise spectrum of the machine (noise source), then the enclosure can be considered large enough to assume that the sound field within the enclosure is diffuse (the sound energy is uniformly distributed within the enclosure). Another criterion [96] used to assume the diffuse sound field condition requires that the largest dimension of the interior volume of the enclosure be less than λ/10.
Therefore, according to classical theory, the reverberant sound pressure level within the enclosure, Lprev, is given by [3, 97]
(9.33)![]()
where T is the reverberation time within the enclosure in seconds, and V is the internal volume of the enclosure in cubic metres. Then, the reverberant sound intensity incident on the internal enclosure walls can be estimated from (See Chapter 3)
(9.34)
where 〈p2〉rev is the reverberant mean‐square sound pressure (space–time average) within the enclosure, ρ is the density of the medium (air) within the enclosure, and c is the speed of sound.
9.6.2 Machine Enclosure in Free Field
The sound field immediately inside of an enclosure consists of two components: (i) the internal reverberant sound field and (ii) the direct sound field of the machine noise source [3]. The fraction of sound energy that is incident on the interior of the enclosure wall that is transmitted outside depends on its transmission coefficient. The transmission coefficient τ of a wall may be defined as
(9.35)![]()
and this coefficient τ is related to the transmission loss TL (or sound reduction index) by
(9.36)![]()
If the enclosure is located in a free‐field, as shown in Figure 9.25, the sound pressure level immediately outside the enclosure is [3, 97]
(9.37)![]()
Therefore, the enclosure with its noise source inside can be considered to be an equivalent sound source placed in free‐field conditions. Now, if the floor is hard and highly reflective, the sound pressure level at a distance r from an enclosure wall can be estimated by
(9.38)![]()
where S is the total outer surface area of the enclosure walls.
9.6.3 Simple Enclosure Design Assuming Diffuse Reverberant Sound Fields
If the sound fields are assumed to be reverberant both inside and outside a completely sealed enclosure (typical of a machine enclosure in a machine shop), then the noise reduction NR is given by
(9.39)![]()
where Lp1 and Lp2 are the reverberant sound pressure levels inside and outside the enclosure, A2 = S2 ![]() is the absorption area in square metres of the outside receiving space where
is the absorption area in square metres of the outside receiving space where ![]() is the surface average absorption coefficient of the absorption material in the receiving space averaged over the area S2, and Se is the enclosure surface area in square metres.
is the surface average absorption coefficient of the absorption material in the receiving space averaged over the area S2, and Se is the enclosure surface area in square metres.
EXAMPLE 9.10
A noisy diesel generator is operated in the middle of the floor of a shop measuring 20 × 20 m by 4 m high. The shop has an average surface absorption coefficient ![]() = 0.1 at 1000 Hz. The machine is placed inside a completely sealed enclosure of 10 m2 surface area. The enclosure is constructed of steel panels having TL = 24.5 dB at 1000 Hz. Determine the noise reduction provided by the enclosure.
= 0.1 at 1000 Hz. The machine is placed inside a completely sealed enclosure of 10 m2 surface area. The enclosure is constructed of steel panels having TL = 24.5 dB at 1000 Hz. Determine the noise reduction provided by the enclosure.
SOLUTION
The room surface area = 2(20 × 20 + 20 × 4 + 20 × 4) = 1120 m2, therefore the absorption area of the outside receiving space is A2 = 1120 × 0.1 = 112 sabins (m2). The noise reduction is obtained from Eq. (9.39): NR = 24.5 + 10log(112/10) = 35 dB. This calculation may be repeated at each frequency for which absorption coefficient and transmission loss data are available.
a) Personnel Booth or Enclosure in a Reverberant Sound Field
Equation (9.39) can be used to design a personnel booth or enclosure in which the noise source is external and the reason for the enclosure is to reduce the sound pressure level inside (see Figure 9.26). If the enclosure is located in a factory building in which the reverberant level is Lp1, then the enclosure wall TL and interior absorption area A2 can be chosen to achieve a required value for the internal sound pressure level Lp2. In the case that the surface area S2 of the internal absorbing material S2 = Se, the enclosure surface area, then Eq. (9.39) simplifies to
(9.40)![]()
The NR achieved is seen to be less than the TL in general. When ![]() , the average absorption coefficient of the absorbing material in the receiving space approaches 1, then NR approaches TL (as expected), although when
, the average absorption coefficient of the absorbing material in the receiving space approaches 1, then NR approaches TL (as expected), although when ![]() approaches 0, then the theory fails.
approaches 0, then the theory fails.
EXAMPLE 9.11
It is desired to build a personnel enclosure in the assembly area of a manufacturing shop. The reverberant level in the manufacturing shop is 85 dB in the 1600‐Hz one‐third octave band. It is required to provide values of TL and ![]() to achieve an interior level inside the personnel enclosure of less than 60 dB.
to achieve an interior level inside the personnel enclosure of less than 60 dB.
SOLUTION
Assuming that S2 = Se, then if TL is chosen as 30 dB and ![]() = 0.2, NR = 30 + 10 log 0.2 = 30−7 = 23 dB, and Lp2 = 62 dB. Now, if
= 0.2, NR = 30 + 10 log 0.2 = 30−7 = 23 dB, and Lp2 = 62 dB. Now, if ![]() is increased to 0.4, then NR = 30 + 10 log 0.4 = 30−4 = 26 and Lp2 = 59 dB, meeting the requirement. Since TL varies with frequency (see Eq. (9.43)), this calculation would have to be repeated for each one‐third octave band center frequency of interest. In addition, at low frequency, some improvement can be achieved by using a thicker layer of sound‐absorbing lining material.
is increased to 0.4, then NR = 30 + 10 log 0.4 = 30−4 = 26 and Lp2 = 59 dB, meeting the requirement. Since TL varies with frequency (see Eq. (9.43)), this calculation would have to be repeated for each one‐third octave band center frequency of interest. In addition, at low frequency, some improvement can be achieved by using a thicker layer of sound‐absorbing lining material.
b) Machine Enclosure in a Reverberant Space
When an enclosure is designed to contain a noise source (see Figure 9.27), it operates by reflecting the sound back toward the source, causing an increase in the sound pressure level inside the enclosure. From energy considerations the insertion loss is zero if there is no sound absorption inside. The effect is an increase in the sound pressure at the inner walls of the enclosure compared with the sound pressure resulting from the direct field of the source alone. The build‐up of sound energy inside the enclosure can be reduced by placing sound‐absorbing material on the walls inside the enclosure. It is also useful to place sound‐absorbing materials inside personnel noise protection booths for similar reasons.
The internal surfaces of an enclosure are usually lined with glass or mineral fiber or an open‐cell polyurethane foam blanket. However, the selection of the proper sound‐absorbing material and its containment will depend on the characteristics of each noise source. Sound absorption material also requires special protection from contamination by oil or water, which weakens its sound absorption properties. If the noise source enclosed is a machine that uses a combustible liquid, or gas, then the material should also be fire‐resistant. Of course, since the sound absorption coefficient of linings is generally highest at high frequencies, the high‐frequency components of any noise source will suffer the highest attenuation.
The effect of inadequate sound absorption in enclosures is very noticeable. Table 9.4 shows the reduction in performance of an ideal enclosure with varying degrees of internal sound absorption [3]. The first column of Table 9.4 shows the percentage of internal surface area that is treated. The sound power of the source is assumed to be constant and unaffected by the enclosure.
For an enclosure that is installed around a source with a considerable amount of absorbing material used inside to prevent any interior reverberant sound energy build‐up, then from energy considerations

if the receiving space is quite absorbent and if IL and TL are averaged over wide frequency bands (e.g. at least one octave). If insufficient sound‐absorbing material is put inside the enclosure, the sound pressure level will continue to increase inside the enclosure because of multiple reflections, and the enclosure effectiveness will be reduced. From energy considerations it is obvious that if there is no sound absorption inside (![]() = 0), the enclosure will be ineffective, and its insertion loss will be zero.
= 0), the enclosure will be ineffective, and its insertion loss will be zero.
An estimate of the insertion loss for the general case 0 < ![]() < 1 can be obtained by assuming that the sound field inside the enclosure is diffuse and reverberant and that the interior surface of the enclosure is lined with absorbing material of surface‐averaged absorption coefficient
< 1 can be obtained by assuming that the sound field inside the enclosure is diffuse and reverberant and that the interior surface of the enclosure is lined with absorbing material of surface‐averaged absorption coefficient ![]() . Let us assume that (i) the average absorption coefficient in the room containing the noise source is not greater than 0.3, (ii) the noise source does not provide direct mechanical excitation to the enclosure walls, and (iii) the noise source volume is less than about 0.3–0.4 of the enclosure volume, then we may show that the insertion loss of a loose‐fitting enclosure made to contain a noise source situated in a reverberant space is [98]
. Let us assume that (i) the average absorption coefficient in the room containing the noise source is not greater than 0.3, (ii) the noise source does not provide direct mechanical excitation to the enclosure walls, and (iii) the noise source volume is less than about 0.3–0.4 of the enclosure volume, then we may show that the insertion loss of a loose‐fitting enclosure made to contain a noise source situated in a reverberant space is [98]
(9.41)![]()
where Lp1 is the reverberant level in the room containing the noise source (with no enclosure), Lp2 is the reverberant level at the same location (with the enclosure), Ae is the absorption area inside the enclosure Si ![]() , and
, and ![]() is the surface average absorption coefficient of this material. If the surface area of the enclosure Se = Si, the area of the interior absorbing material, then Eq. (9.41) simplifies to
is the surface average absorption coefficient of this material. If the surface area of the enclosure Se = Si, the area of the interior absorbing material, then Eq. (9.41) simplifies to
(9.42)![]()
We see that normally the insertion loss of an enclosure containing a noise source is less than the TL. If ![]() , the average absorption coefficient of the internal absorbing material approaches 1, the IL approaches TL (as expected), although when
, the average absorption coefficient of the internal absorbing material approaches 1, the IL approaches TL (as expected), although when ![]() approaches 0, then this theory fails.
approaches 0, then this theory fails.
Table 9.4 Change in noise reduction performance of enclosure as function of percentage of internal surface covered with sound absorptive material.
| Percent Sound‐Absorbent (%) | Change in NR (dB) |
|---|---|
| 10 | −10 |
| 20 | −7 |
| 30 | −5 |
| 50 | −3 |
| 70 | −1.5 |
EXAMPLE 9.12
Consider that the sound pressure level Lp1 in a reverberant woodworking shop caused by a wood‐planing machine in the 1600‐Hz one‐third octave band is 90 dB. Then what values of TL and ![]() should be chosen for a loose‐fitting enclosure made to contain the machine to guarantee that the reverberant level will be less than 60 dB?
should be chosen for a loose‐fitting enclosure made to contain the machine to guarantee that the reverberant level will be less than 60 dB?
SOLUTION
Assuming that Si = Se, then if TL is chosen to be 40 dB and ![]() = 0.1, IL = 40 + 10 log 0.1 = 40−10 = 30 dB and Lp2 = 60 dB. Now, if
= 0.1, IL = 40 + 10 log 0.1 = 40−10 = 30 dB and Lp2 = 60 dB. Now, if ![]() is increased to 0.2, then IL = 40 + 10 log 0.2 = 40−7 = 33 dB and Lp2 = 57 dB, thus meeting the requirement. As in Example 9.10, we can observe that since TL varies with frequency f (see Eq. (9.43)), this calculation should be repeated at each frequency of interest. At low frequencies, since large values of TL and
is increased to 0.2, then IL = 40 + 10 log 0.2 = 40−7 = 33 dB and Lp2 = 57 dB, thus meeting the requirement. As in Example 9.10, we can observe that since TL varies with frequency f (see Eq. (9.43)), this calculation should be repeated at each frequency of interest. At low frequencies, since large values of TL and ![]() are difficult to achieve, it may not be easy to obtain large values of IL.
are difficult to achieve, it may not be easy to obtain large values of IL.
Thus the TL can be used as an approximate guide to the IL of a sealed enclosure only when allowance is made for the sound absorption inside the enclosure. The transmission loss of an enclosure is usually mostly governed by the mass/unit area ρs of the enclosure walls (except in the coincidence‐frequency region). The reason for this is that when the stiffness and damping of the enclosure walls are unimportant, the response is dominated by inertia of the walls ρs(2πf) where f is the frequency in hertz. The transmission loss of an enclosure wall for sound arriving from all angles is approximately
(9.43)![]()
where ρs is the surface density (mass/unit area) of the enclosure walls and C = 47 if the units of ρs are kg/m2 and C = 34 if the units are lb./ft2. Equation (9.43) is known as the field‐incidence mass law (see Chapter 12 of this book). The transmission loss of a wall (given by Eq. (9.43)) theoretically increases by 6 dB for each doubling of frequency or for each doubling of the mass/unit area of the wall.
Where the enclosure surface is made of several different materials (e.g. concrete or metal walls and glass), then the average transmission loss TLave of the composite wall is given by
(9.44)![]()
where the average transmission coefficient ![]() is
is
(9.45)![]()
where τi is the transmission coefficient of the ith wall element and Si is the surface area of the ith wall element (m2).
In general, it is difficult to predict the insertion loss of an enclosure with a high degree of accuracy. This is because both the sound field inside and outside the enclosure cannot always be modeled using simple approaches. The models discussed so far are valid for large enclosures where resonances do not arise. However, in the design of enclosures at least two types of enclosure resonances have to be taken into account: (i) structural resonances in the panels that make up the enclosure and (ii) standing‐wave resonances in the air gap between the machine and the enclosure. At each of these resonance frequencies, the insertion loss due to the enclosure is significantly reduced and in some instances can become negative, meaning that the machine with the enclosure may radiate more noise than without the enclosure. Therefore, the enclosure should be designed so that the resonance frequencies of its constituent panels are not in the frequency range where high insertion loss is required.
If the sound source being enclosed radiates predominantly low‐frequency noise, then the enclosure panels should have high natural frequencies, that is, the enclosure should be stiff and not massive. These requirements are very different from those needed for good performance of a single‐leaf partition at frequencies below the critical frequency. To achieve a high insertion loss in the stiffness‐controlled region, benefit can be gained by employing small panel areas, large panel aspect ratios, clamped edge conditions, and materials having a high bending stiffness [99].
On the other hand, a high‐frequency sound source requires the use of an enclosure with panels having low natural frequencies, implying the need for a massive enclosure. Additionally, the panels of the enclosure should be well damped. This would increase IL, in particular for frequencies near and above the critical frequency and at the first panel resonance. Mechanical connections between the sound source and the walls of the enclosure, air gap leaks, structure‐borne sound due to flanking transmission, vibrations, and the individual radiation efficiency of the walls of the enclosure will reduce the IL in different frequency ranges.
For a sealed enclosure without mechanical connections between the source and the enclosure walls, the problem can be divided in three frequency ranges: (i) the low‐frequency range, where the insertion loss is frequency independent and corresponds to frequencies below air gap or panel resonances, (ii) the intermediate‐frequency range, where the insertion loss is controlled by panel and/or air gap resonances that do not overlap so that statistical methods are not applicable, and (iii) the high‐frequency range, where high modal densities exist, consequently, statistical energy methods can be used for modeling. The insertion loss in the intermediate frequency region fluctuates widely with frequency and position and thus is very difficult to analyze by theoretical methods [96, 100]. Reference [101] discusses other models for estimating insertion loss of enclosures.
9.6.4 Close‐Fitting Enclosures
In many cases when machines are enclosed it is necessary to locate the enclosure walls close to the machine surfaces, so that the resulting air gap is small. Such enclosures are termed close‐fitting enclosures. In such cases the sound field inside the enclosure is neither reverberant nor diffuse, and the theory discussed at the beginning of this section can be used to calculate a first approximation of the insertion loss of an enclosure.
There are several effects that occur with close‐fitting enclosures. First, if the noise source has a low internal impedance, then in principle the close‐fitting enclosure can “load” the source so that it produces less sound power. However, in most machinery noise problems, the internal impedance of the source is high enough to make this effect negligible. Second, and more importantly, reductions in the IL occur at certain frequencies (when the enclosure becomes “transparent”). These frequencies f0 and fsw are shown in Figure 9.28. When an enclosure is close‐fitting, then to a first approximation the sound waves approach the enclosure walls at normal incidence instead of random incidence. When the air gap is small, then a resonant condition at frequency f0 occurs where the enclosure wall mass is opposed by the wall and air gap stiffness. This resonance frequency can be increased by increasing the stiffness, as seen in Figure 9.28. In addition, standing‐wave resonances can occur in the air gap at frequencies fsw. These resonances can be suppressed by the placement of sound‐absorbing material in the air gap [102, 103].
Jackson has produced simple theoretical models for close‐fitting enclosures that assume a uniform air gap [102, 103]. He modeled the source enclosure problem in terms of two parallel infinite panels separated by an air gap, as shown in Figure 9.29. One panel is assumed to be vibrating and to be the noise source, and the second panel is assumed to be an enclosure panel. Then, the enclosure performance is specified in terms of the relative vibration levels of the two panels. Later, Junger considered both the source panel and enclosure panel to be of finite area [104]. He assumed that the source panel vibrates as a uniform piston and the enclosure panel vibrates as a simply supported plate excited by a uniform sound pressure field. Comparisons of the Jackson, Junger, and Ver [96] models have been presented by Tweed and Tree [105].
Fahy has presented details of an enclosure prediction model based upon a one‐dimensional model similar to that of Jackson [106]. It is assumed that the enclosure panel is a uniform, nonflexible partition of mass per unit area ρs, and it is mounted upon viscously damped, elastic suspensions, having stiffness and damping coefficients per unit area s and r, respectively. The insertion loss of the enclosure in this one‐dimensional case is [106]
(9.46)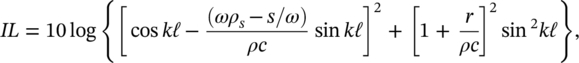
where k = ω/c is the wavenumber, and ℓ is the separation distance between the source and enclosure panel. From an examination of Eq. (9.46) it is clear that the insertion loss will be zero at frequencies when the cavity width ℓ is equal to an integer number of half‐wavelengths and the panel enclosure velocity equals the source surface velocity. The insertion loss will also have a minimum value at the frequency ω0
(9.47)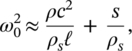
where ω0 = 2πf0. Figure 9.30 shows a generalized theoretical insertion loss performance of a close‐fitting enclosure, according to Eq. (9.46).
Other theoretical models to predict the acoustical performance of close‐fitting enclosures have been reported in the literature [107, 108]. However, in practice, the real source panel exhibits forced vibrations in a number of modes and the air gap varies with real enclosures. Thus these simple theoretical models and some later ones can only be used to give some guidance of the insertion loss to be expected in practice. Finite element and boundary element approaches can be used to make insertion loss predictions for close‐fitting enclosures with complicated geometries and for the intermediate frequency region [109].
9.6.5 Partial Enclosures
When easy and continuous access to parts of a machine is necessary or the working process of the machinery or the safety or maintenance requirements do not allow a full enclosure, a partial enclosure is usually used to reduce the radiated noise [110]. Figure 9.31 shows an example of a partial enclosure used in machinery noise control. The noise reduction produced by a partial enclosure will depend upon the particular geometry. Most of the time, the available attenuation will be limited by diffractive scattering and mechanical connections between the partial enclosure and the vibrating machine. It is recommended that partial enclosures be fully lined with sound absorption material. As a general rule, the enclosure walls of a partial enclosure should have a transmission loss of at least 20 dB. The maximum sound power reduction that can be achieved for such an enclosure is about 10 dB. However, in some cases, the noise levels radiated may be reduced more. Table 9.5 shows the effectiveness of partial enclosures, where the values are based on the assumption that the noise source radiates uniformly in all directions and that the partial enclosure that surrounds the source is fully lined with sound‐absorptive material [111].
Table 9.5 Effectiveness of a partial enclosure.
| Sound Energy Enclosed and Absorbed (%) | Maximum Achievable Noise Reduction (dB) |
|---|---|
| 50 | 3 |
| 75 | 6 |
| 90 | 10 |
| 95 | 13 |
| 98 | 17 |
| 99 | 20 |
9.6.6 Other Considerations
Most equations presented in this chapter will give good estimates for the actual performance of an enclosure. However, some guidelines should be followed in practice to avoid degradation of the effectiveness of an enclosure. In addition, when designing an enclosure, care should be taken so that production costs and time, operational cost‐effectiveness, and the efficiency of operation of the machine or equipment being enclosed are not adversely affected.
Most enclosures will require some form of ventilation through duct openings. Such necessary permanent openings must be treated with some form of silencing to avoid substantially degrading the performance of the enclosure. For a good design, it is required that the acoustical performance of silencing of the permanent duct openings will match the performance of the enclosure walls. The usual techniques employed to control the sound propagation in ducts can be used for the design of silencers [112].
When ventilation for heat removal is required but the heat load is not large, then natural ventilation with silenced air inlets low down close to the floor and silenced outlets at a greater height, well above the floor, will be adequate. If forced ventilation is needed to avoid excessive heat build‐up in the enclosure, then the approximate amount of airflow needed can be determined by [3]
(9.48)![]()
where V is the volume flow rate of the cooling air required (m3/s), H is the heat input to the enclosure (W), ΔT is the temperature differential between the external ambient and the maximum permissible internal temperature of the enclosure (°C), ρ is the air density (kg/m3), and Cp is the specific heat of the air (m2C−1/s2). When high‐volume flow rates of air are required, the noise output of the fan that provides the forced ventilation should be considered very carefully, since this noise source can degrade the performance of the enclosure. In general, large slowly rotating fans are always preferred to small high‐speed fans since fan noise increases with the fifth power of the blade tip speed.
The effectiveness of an enclosure can be very much reduced by the presence of leaks (air gaps). These usually occur around removable panels or where ducts or pipes enter an enclosure to provide electrical and cooling air services and the like. If holes or leaks occur in the enclosure walls (e.g. cracks around doors or around the base of a cover) and if the TL of the holes is assumed to be 0 dB (as is customary), then the reduction in insertion loss as a function of the TL of the enclosure walls, with the leak ratio factor β as the parameter, is given by Figure 9.32 [96]. The leak ratio factor β is defined as the ratio of the total face area of the leaks and gaps to the surface area (one side) of the enclosure walls.
If the penetrations in the enclosure walls are lined with absorbing materials as shown in Figure 9.33, then the degradation in the enclosure IL is much less significant. Some studies indicate that leaks not only degrade the noise reduction but also can introduce resonances when the leak ratio factor is not very large [113].
It is necessary to provide sufficient vibration isolation to reduce the radiation of noise from the surface on which the machinery is mounted, particularly if low‐frequency noise is the main problem. Therefore, it is advisable to mount the machine and/or the enclosure itself on vibration isolators that reduce the transmission of energy to the floor slab. In doing so, control of both the airborne and the structure‐borne sound transmission paths between the source and receiver will be provided. Great care is necessary to ensure that the machine will be stable and its operation will not be affected adversely. Insertion of flexible (resilient) connectors between the machine and conduit, cables, piping, or ductwork connected to it must be provided to act as vibration breaks.
In addition, proper breaking of any paths that permit noise to “leak” through openings in the enclosure must be provided. Then all joints, seams, and penetrations of enclosures should be sealed using a procedure such as packing the leaks with mineral wool, which are closed by cover plates and mastic sealant [3].
Any access doors to the enclosure must be fitted tightly and gasketed. Locking handles should be provided that draw all such doors tightly to the gasketed surfaces so as to provide airtight seals. Inspection windows should be double‐glazed and the glass thicknesses and pane separations should be chosen carefully to avoid degradation by structural/air gap resonances. Placing porous absorbing material in the reveals between the two frames supporting the glass panes can improve the transmission loss of a double‐glazed inspection window. Figure 9.34 shows an enclosure in which some basic noise control techniques have been applied. Figure 9.35 shows an enclosure for a compressor driven by a diesel engine. In this design, sound‐absorbing material is located inside the enclosure, and air paths are provided for the passage of cooling air. Reference [114] gives extensive details of a theoretical and experimental acoustical design study of the inlet cooling duct for the compressor enclosure.
Figure 9.36 shows an enclosure built for a bandsaw. A sliding window is provided that can be opened for access to controls. A sliding door is also provided that can be closed as much as possible around items fed to the bandsaw. The interior of the enclosure is lagged with 50 mm of sound‐absorbing material. Enclosures are available from manufacturers in a wide variety of ready‐made modular panels. Figure 9.37 shows how these panels can be built into a variety of complete machine enclosures and partial and complete personnel enclosures. Information about cost, construction details, and performance of several enclosures can be found in the manufacturers’ literature and in some books [115].
Leave a Reply