What is the Three Inside Up/Down Pattern?
Three inside up and three inside down are three-candle reversal patterns that form on candlestick charts. The pattern needs three candles to form in a particular sequence, indicating that the current trend has lost momentum and a move in the other direction might be starting.
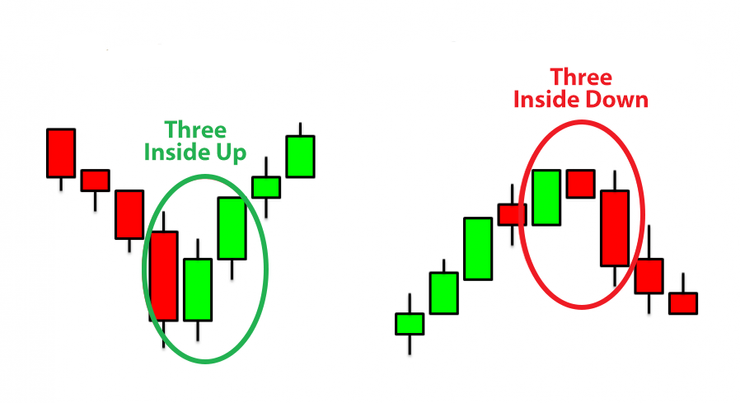
Three Inside Up pattern
The three inside up candlestick pattern is similar to the morning star triple candlestick pattern – it shows a potential trend reversal found at the end of a downtrend. Traders may believe the pattern more than a bullish harami because a confirmation candle may be present. It is easier to trust because of the assurance it gives. The characteristics of the pattern are:
- The first candle is long and bearish, showing that the market is still in a downtrend.
- The second candle is bullish and is ideally close at the halfway mark of the first candle.
- The third candle is also bullish and closes above the open of the first candlestick, mostly above the high of the second candle.
Three Inside Down pattern
The three inside down candlestick pattern is the opposite of the three inside up pattern and shows a trend reversal located at the end of an uptrend.
- The first candle is long and bullish, showing that the market is still in an uptrend.
- The second candle is bearish and ideally closes at the halfway mark of the first candle.
- The third candle is also bearish and closes above the open of the first candle, mostly below the low of the second candle.
How to identify the Three Inside Up & Down pattern?
- First, a downtrend should be happening.
- Second, a tall black (or red) candle has to appear, continuing the downward movement.
- Third, a small white (or green) candle has to form on the following day, and its body has to be contained within the body of the previous day. Either the tops or the bottoms of the bodies may be the same price.
- Fourth and finally, another white (or green) candle must appear, closing above the close of the prior day.
As mentioned above, this is a confirmed bullish harami pattern. The first two candles make up the harami, and the third confirms the bullish reversal. Traders are more likely to trust the reversal because of that last candle, which offers assurance.
If you see a grouping of candles that seem to be the opposite of this one (a big white candle, a small black candle found within it, and a black candle that closes below the close of the prior day), you may have located a three inside up/down candlestick pattern.
Finally, observe how similar this pattern is to the morning star. The major difference is that in the three inside up, the second candle has to be contained within the body of the first candle. Also, in the morning star, the final candle has to close at least halfway up the candle of the first day.
What does the Three Inside Up/Down pattern tell traders?
A reversal candlestick pattern signal is stronger if it occurs after a steep trend because the markets can hardly sustain a quick price movement; a correction can usually be expected.
If the second candle does not get to the halfway point of the first candlestick, but the third still closes beyond the open or the low of the first candle, it may be seen as a valid three inside down pattern.
Formation of this candlestick pattern speaks about the market sentiments that the bulls are trying to take over the bears. The third day formation of a bullish candle, forming a new high, offers more confirmation of bulls rally is going to continue.
How to trade when you see the Three Inside Up/Down pattern?
This pattern is an interesting signal to have in your trading tool belt
Even though a lot of new traders would try and apply the three inside up to their market as soon as they have learned about it, this isn’t a good idea! Of all candlestick patterns out there none is worth trading in its raw form. You need to include filters that get rid of some of the false trades, and make the pattern worthwhile. You also have to ensure that you trade a market and timeframe where the pattern works well. It is recommended that you make use of back testing to know where the pattern works.
The pattern doesn’t necessarily have to be traded. It can just be used as an alert that the short-term price direction may be changing.
For traders that do wish to trade it, a long position can be entered close to the end of the day on the third candle, or on the following open for a bullish three inside up. A stop-loss can be set below the low of the third, second, or first candle. This depends on how much risk the trader is willing to take.
For a bearish three inside down, a trader could enter a short position close to the end of the day on the third candle or at the open the next day. A stop-loss can be placed above the high of the third, second, or first candle.
The patterns do not have profit targets; therefore, it is best to use another method for deciding when to take profits, if they develop. This could include using a trailing stop-loss, leaving at a particular risk/reward ratio, or making use of technical indicators or other candlestick patterns to indicate an exit.
A quite common pattern
The pattern is generally common, and therefore not always dependable. It is also short-term, so, while it may occasionally lead to major trend changes, it may bring about only a small to medium-sized move in the new direction. Following the pattern, the price may not follow through in the direction expected at all, and may instead change course once again, in the direction of the original trend.
Trading in the same direction as the long-term trend could help improve the performance of the pattern. Therefore, during a general uptrend, consider looking for the three inside up during a pullback. This could indicate that the pullback is over and the uptrend is coming back.
During a downtrend, observe for the three inside down preceding a small move higher. This could indicate the end of the higher move and the resumption of the downtrend.
Idea of a trading process
- Watch for first bearish candlestick to form
- Next, watch for second smaller spinning top or doji candlestick to form
- Then, watch for third and fourth candlesticks to form higher highs
- Take a long position once price breaks above the fourth candlestick
- Put a stop below the fourth candle
- Some traders usually take short positions once price breaks below fourth candle
- Then place stop above the fourth candle
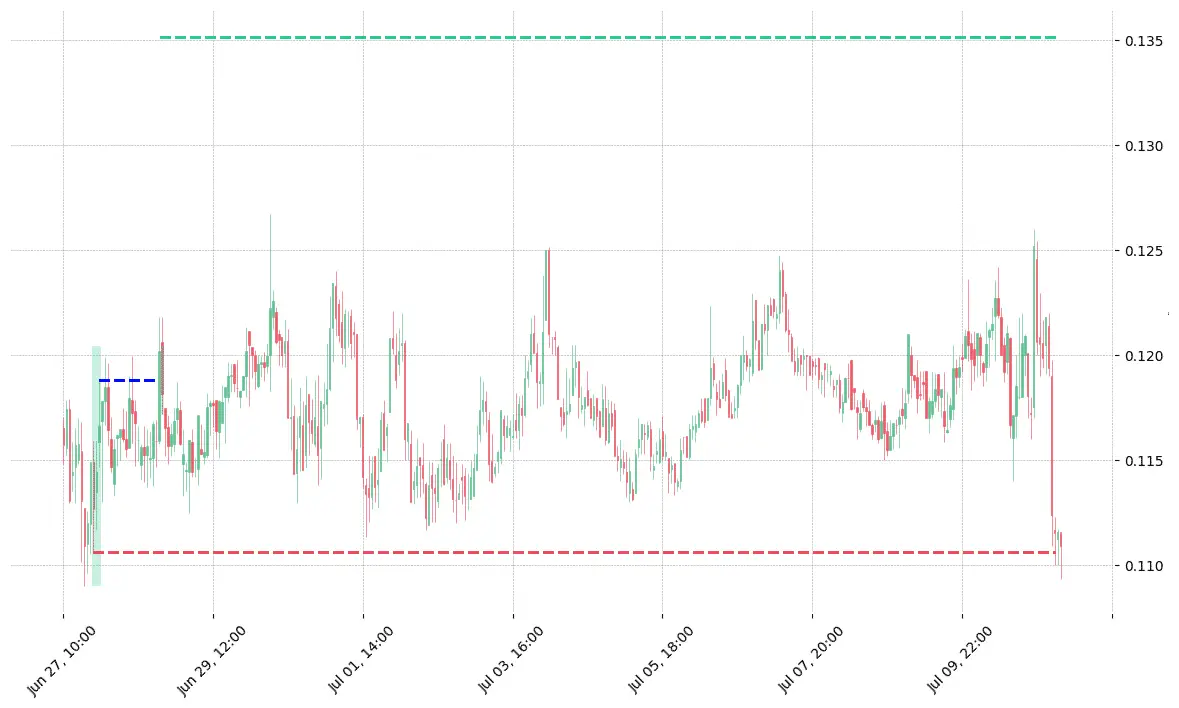
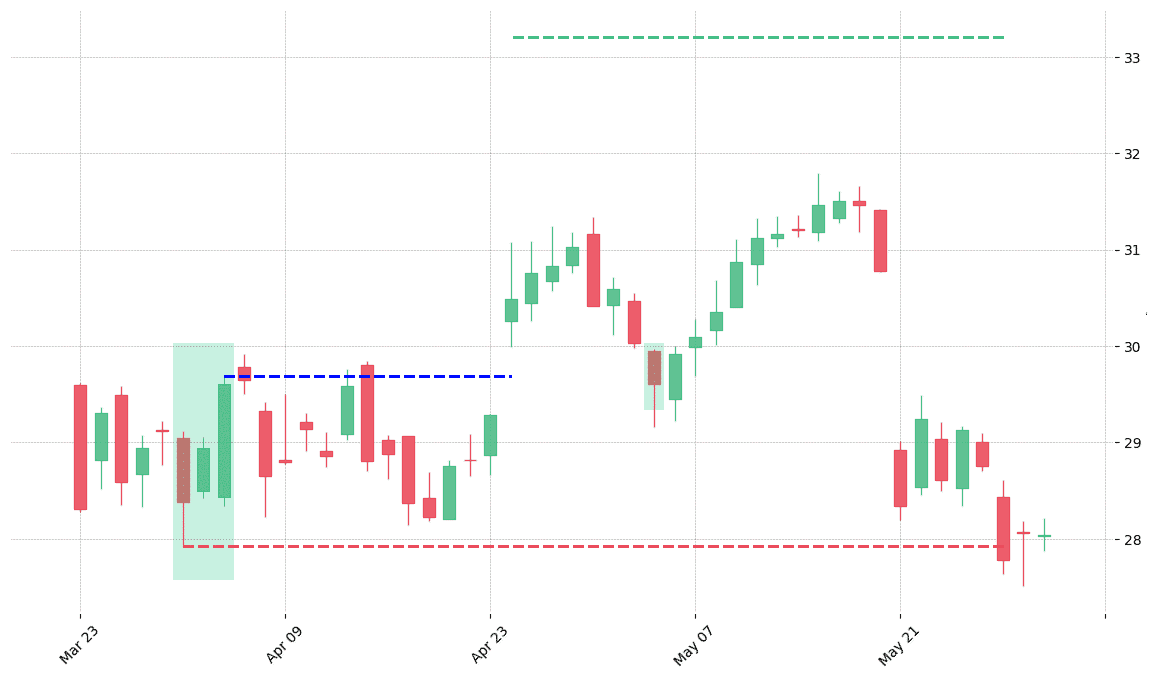
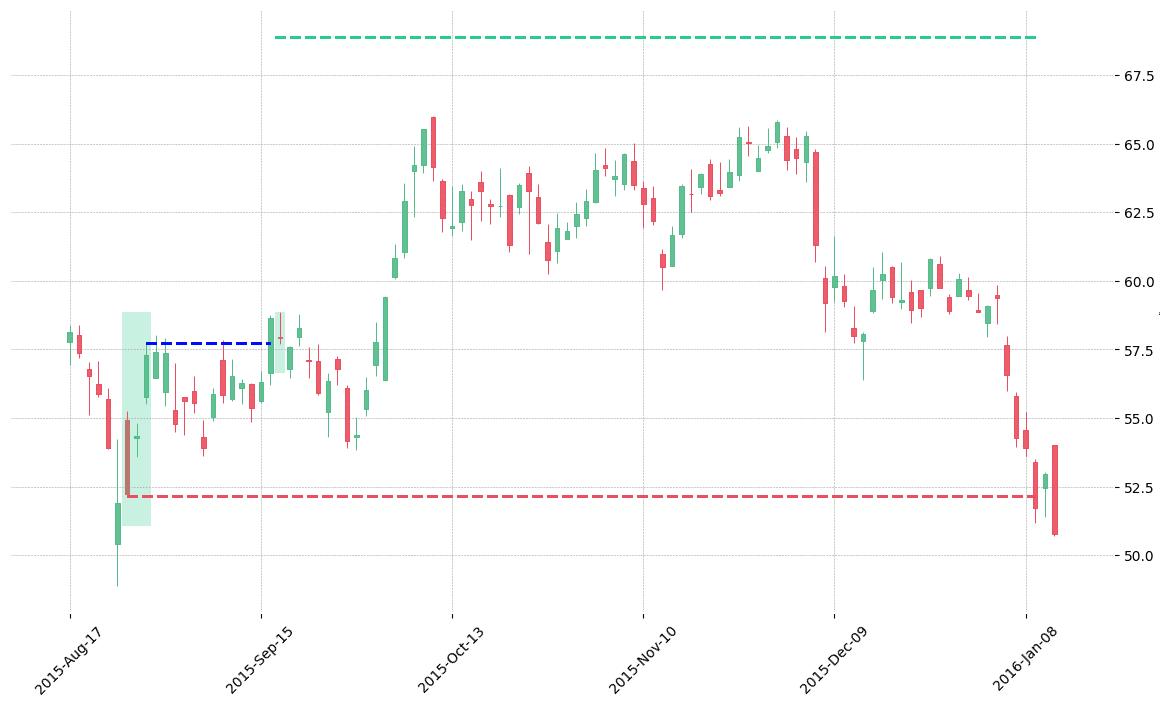
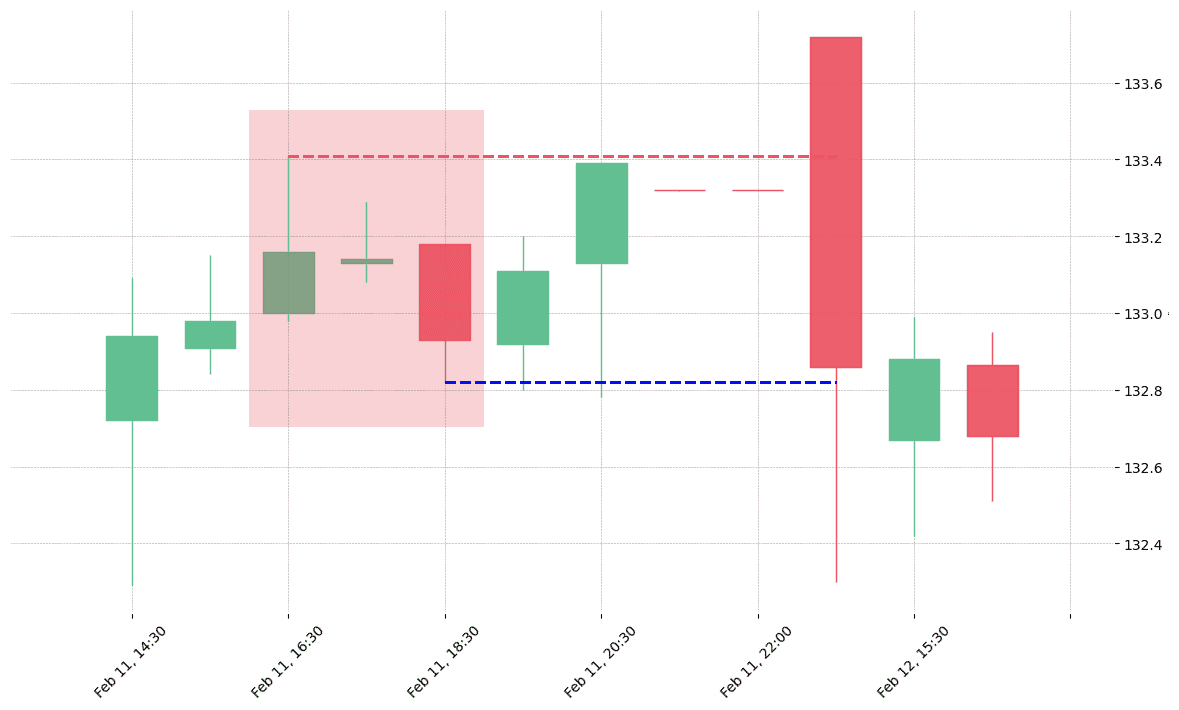
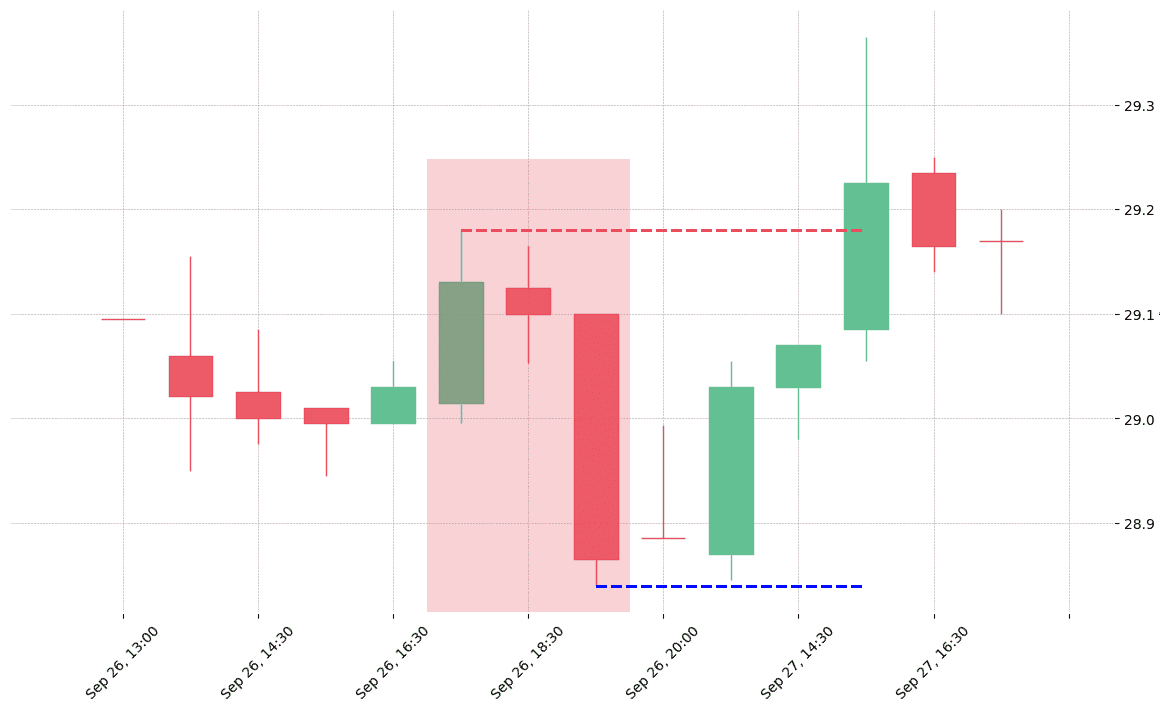
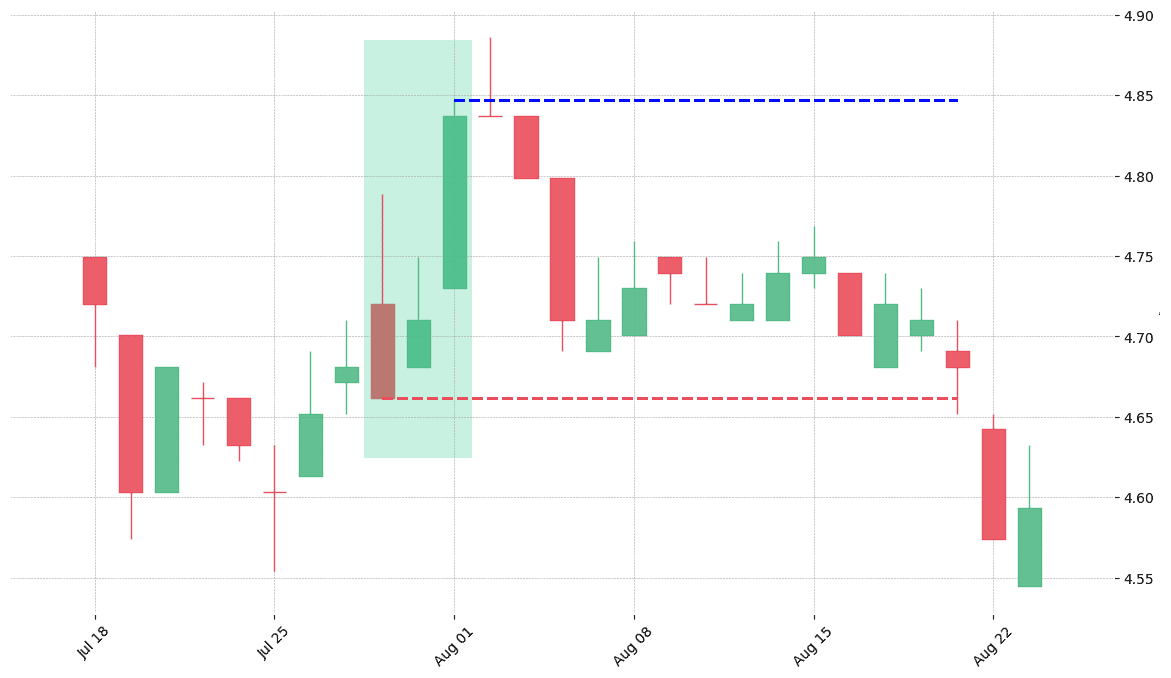
How does the Three Inside Up & Down pattern look in real life?
Leave a Reply