What is the Volume Profile indicator?
Volume Profile is an advanced charting study and indicator. It shows the traded volume amount of an asset over a specified period, at certain price levels. Volume Profile makes use of previous traded volume and all the strategies and plans are brought from historical data.
Traders focus on the regions where a reversal could occur with volume profile. Some people believe that volume profile analysis provides traders with an “unfair” advantage as a result of market context and that institutions and banks use such strategies.
What is Volume?
Volume, also referred to as volume of trade, gives the total number of shares or stocks traded for a specific security. Volume indicates the amount of transactions that carried out. As a result, it can also measure the liquidity of security. A security is active or liquid when volumes are high.
How does indicator work?
The volume profile can come in any shape depending on the distribution of volumes. It draws by using horizontal lines to form a histogram. The more the volume trades at a given level, the bigger the profile becomes.
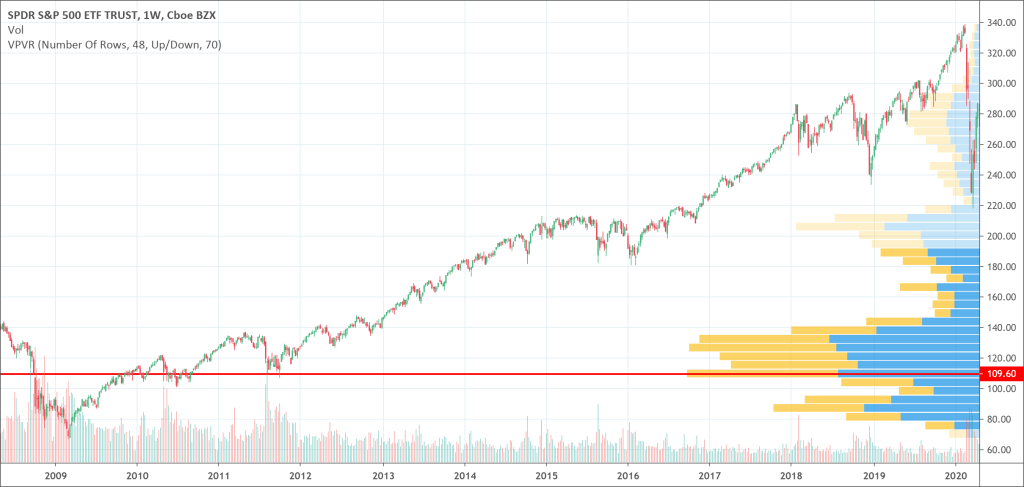
The volume profile is usually located at the right side of the chart beside the price levels. Bars represent it. The volume profile bars are created by getting total volume traded at a price, in a given time. The total buy is then divided, and volumes sold representing it on a histogram chart. Traders can understand and use the volume profile indicator as one of the important tools among all their technical analysis tools.
Types of Volume Profile
There are three different kinds of volume profile used in trading. There is not so much difference in the way they all operate. The differences that exist amongst them are the way they appear on the chart and the ease of access to volume profile on the precise time period you want to view.
- Volume Profile Visible Range (VPVR): Volume Profile Visible Range (VPVR) is the basic volume profile tool most trader use. It appears next to price levels on histogram. It displays the volume traded in the price level automatically from the candles displayed on the screen. When one go back and forth in the price action’s time period, the volume profile visible range will change.
- Volume Profile Fixed Rage (VPFR): This is almost the same volume profile with the VPVR, only with a little difference. When one wants to view the traded volume in a period of price action, like the uptrend or downtrend, you can determine the initial and final point and view the volume profile only for that time period.
- Volume Profile Session Volume (VPSV): This displays all the volume profile of the session that is appearing on the chart. Each session presenting on the chart has a volume profile grouped with it. Each session is considered daily and that goes for the change of time period of the chart.
Leave a Reply