What is the Inverted Hammer candlestick pattern?
As far as the inverted hammer pattern is concerned it should be understood that it is a strong early indication of a possible upcoming price change. It is not necessarily a signal to purchase. The inverted Hammer candlestick pattern is similar to the shooting star formation. The important characteristics define the pattern. At this time the close, low and open is approximately the same price. There will also be a long upper shadow which should be at least double the length of the main body.
How to identify the pattern?
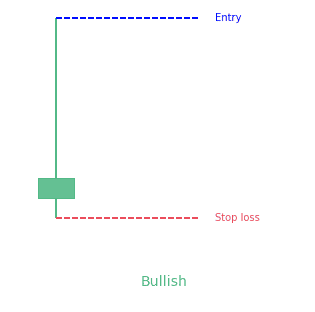
The inverted hammer pattern as a small body. There is also an extended upper wick although almost no or very little in the way of a lower wick. This will be visible at the bottom of a downtrend and can be an indication of a potential bullish reversal. Furthermore, the extended upper wick could be telling investors that the bulls may have plans to drive prices higher. A more accurate picture will emerge through subsequent price action which may reject or confirm the emerging changes.
What does the Inverted Hammer pattern tell traders?
It should always be remembered that investing with the inverted hammer principle goes beyond the mere identification of the candle. Many factors come into play such as the location of the hammer handle and price action. The existing trend is an important point to take into consideration for your analysis. All of these things are important validating factors when it comes to this particular candlestick pattern.
How to trade when you see the pattern?
It is important when making the decision to trade when the inverted hammer candlestick pattern appear to also keep an eye out for other important signals which will collaborate a possible reversal. Nevertheless, if you are certain that a change will occur then you can trade by using spread bets or CFD’s. Both of these is offshoot products which simply provides investors the opportunity to trade on both falling and rising prices.
There are several options such as to trade and or by going along or buying but if there is a possibility that the signal is not promising enough and when there seem to be a chance that the downward trend is likely to continue then there is also the option to sell or to go short.
Additional information
Many traders will tell you that the inverted hammer candlestick pattern and its derivatives are easily identified and very common reversal patterns when it comes to a technical analysis of the various financial markets and it is also significant when it comes to crypto traders. In most cases the candlestick varieties will make their appearance at the end of down trending price action and they can be identified by a long wick or shadow which is at a minimum twice the size of the main body. Investors will see a small body indicating that high, open and close a just about the same price.
Differences with other patterns
There is also the bearish version of the inverted hammer which is known as the hanging man formation. When it comes to the hanging man this is simply a type of bearish reversal pattern which is signified by a single candle which appears in an uptrend and which is mostly a strong indication of a possible downward reversal.
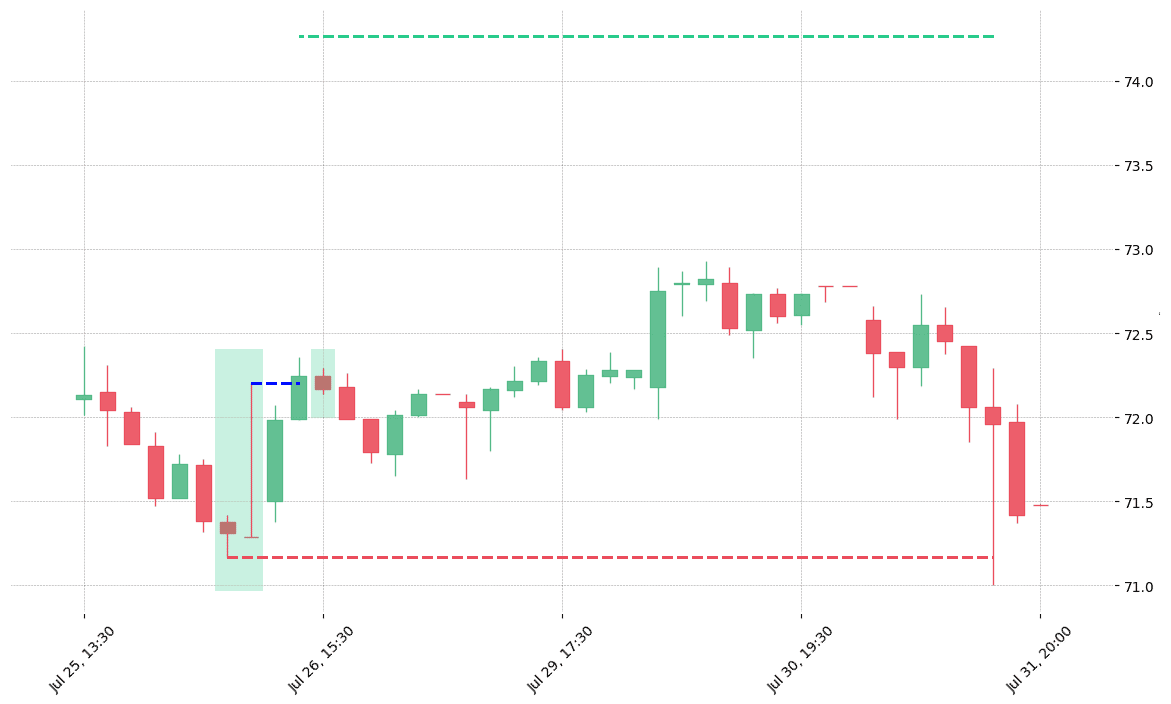
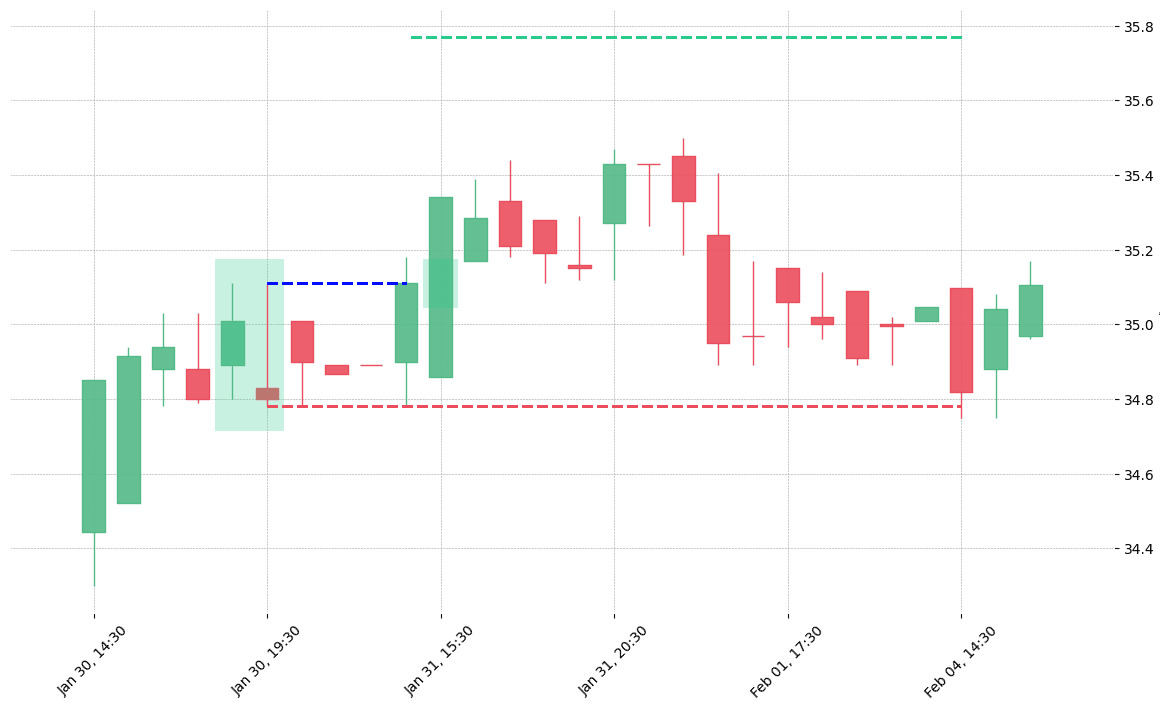
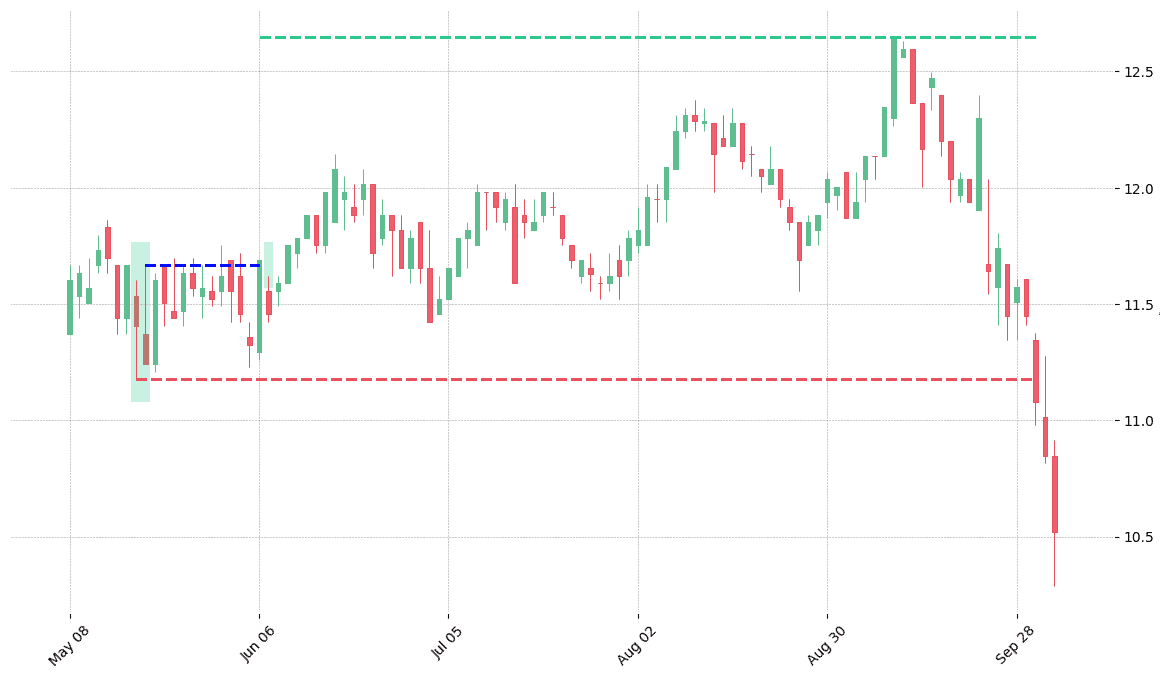
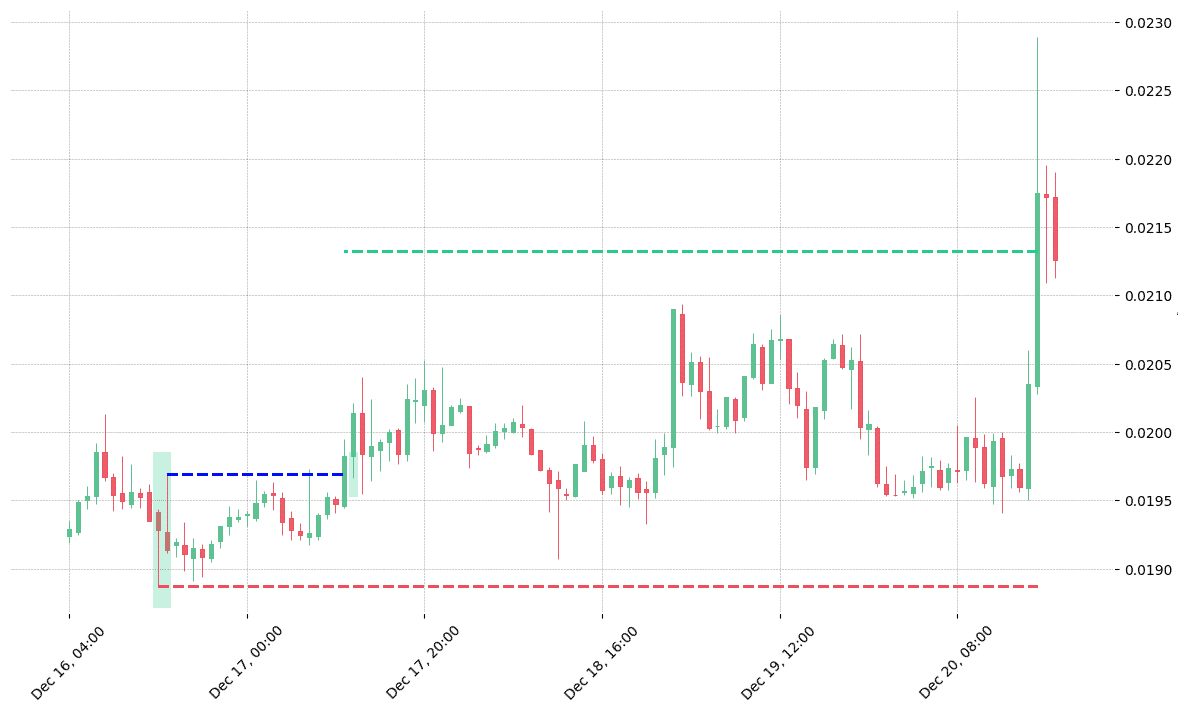
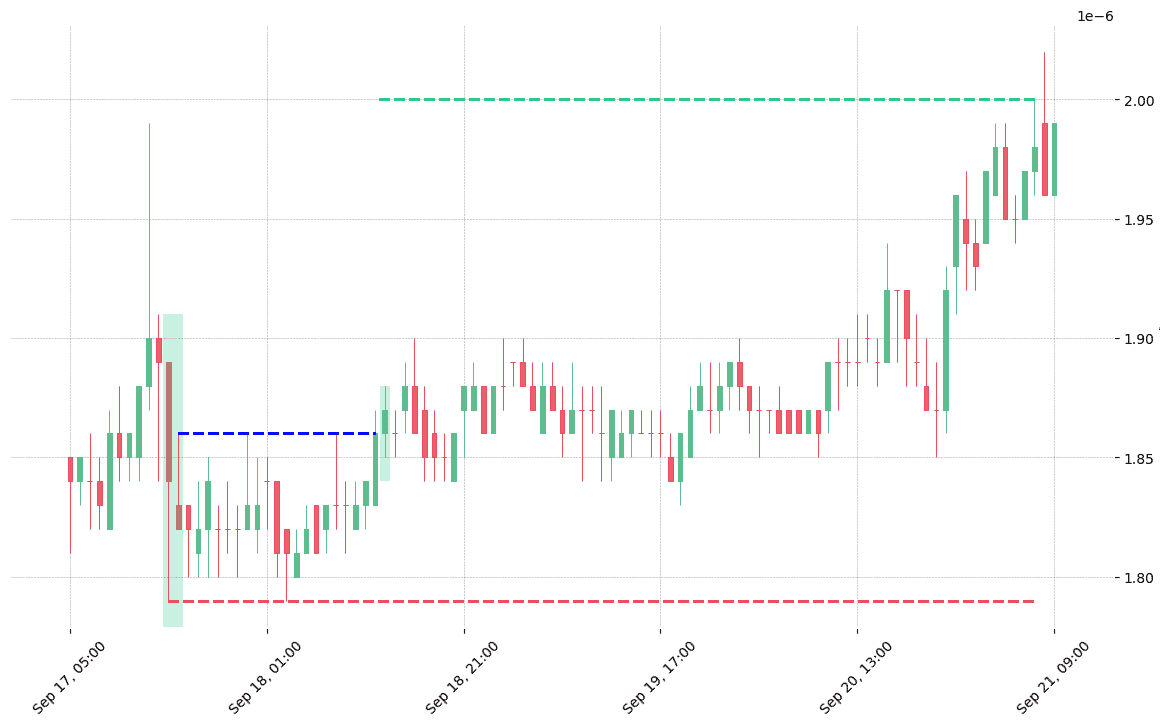
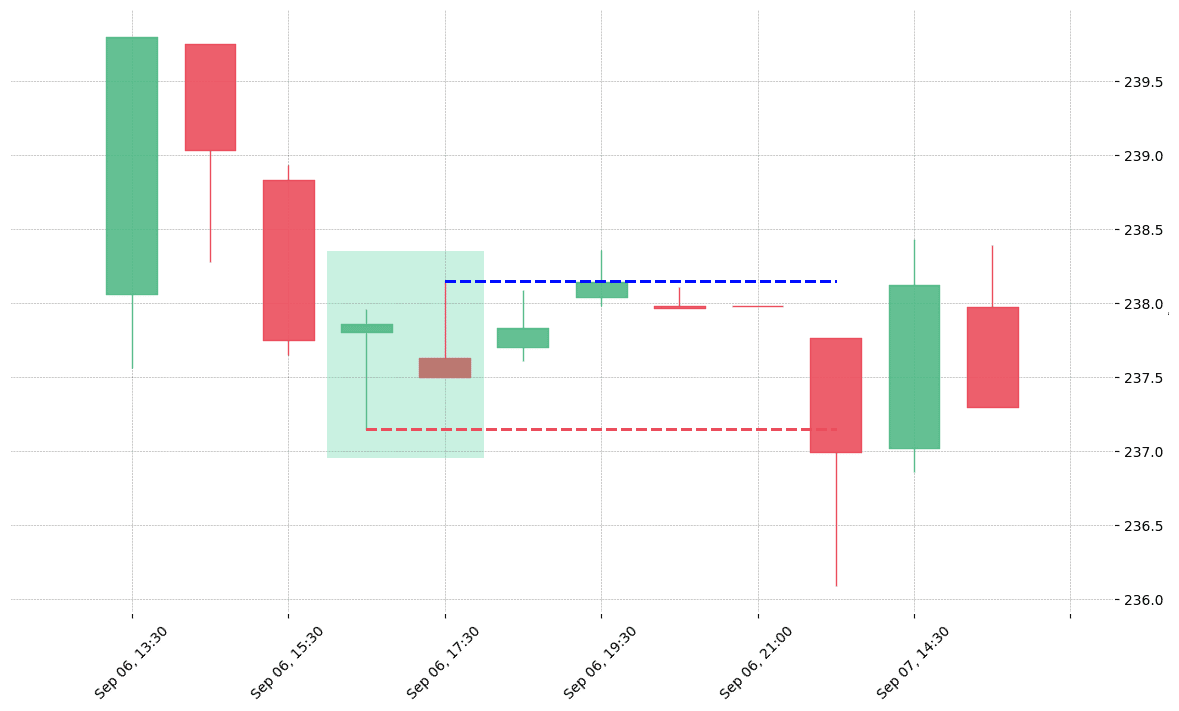
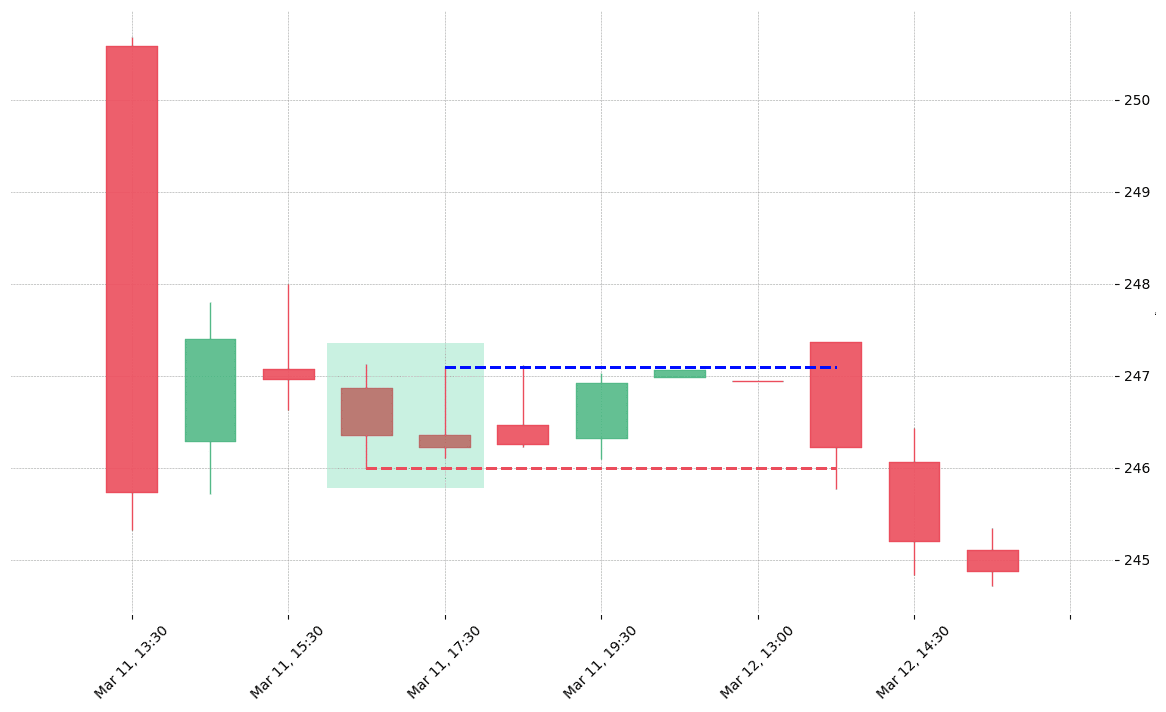
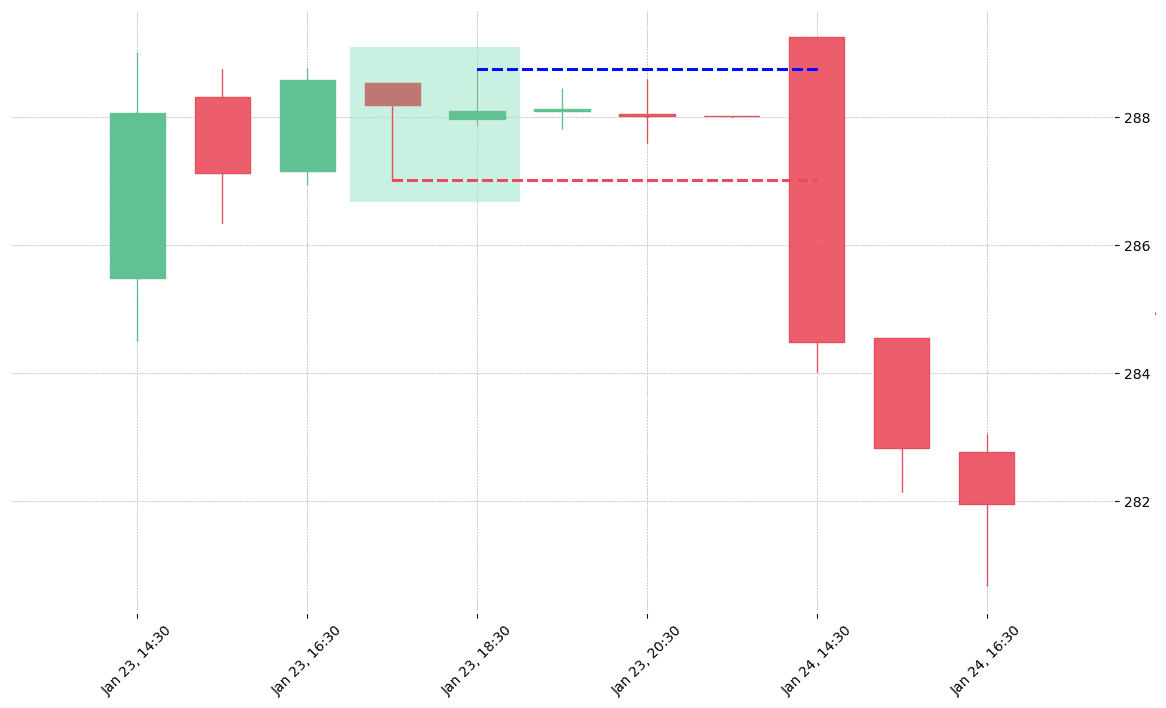
How does the Inverted Hammer pattern look in real life?
Leave a Reply