What is the Morning Star pattern?
Overview
A morning star is a visual three candlesticks pattern. Technical analysts usually interpret it as a bullish sign. It forms following a downward trend and it shows the start of an upward climb. It is a sign of a reversal in the previous price trend. Traders hunt for the formation of a morning star candlestick pattern. They then get confirmation that a reversal is surely occurring using additional indicators.
The morning star candlestick is a three-candle pattern that shows a reversal in the market. It can be used when trading markets of any type. It is crucial to correctly spot reversals when trading financial markets because it makes it possible for traders to enter at good levels at the beginning of a possible trend reversal.
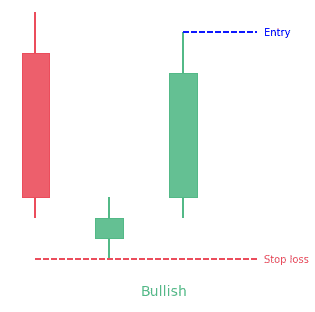
The pattern is made up of three candlesticks:
- large bearish candle (day 1)
- small bearish or bullish candle (day 2)
- and large bullish candle (day 3)
Some details about each of the 3 candles
The first part of the morning star reversal pattern is a big bearish red candle that appears on the first day; they are definitely in charge and make new lows. The second day starts with a bearish gap down. It is clear from the start of day 2 that bears are in control. This time, bears do not push the prices to a much lower position. The candlestick of the second day is small and can be bearish, bullish, or neutral (or Doji).
Generally, a bullish candle on day 2 is seen as a stronger indicator that there’s and impending reversal. But the most significance is seen in day 3. It starts with a bullish gap up, making it possible for bulls to push the price even further upward. It mostly gets rid of the losses of day 1. Traders observe the formation of a morning star pattern on the price chart. They then can confirm it with their other favorite technical tools (as defined in their trading plan).
Leave a Reply