The psychrometric chart is a graphical representation of the complete thermodynamic properties of moist air and psychrometric analysis of air-conditioning processes. The chart most commonly used is the w-td chart, which specifies specific humidity (ω) or water vapour pressure (pv) along the ordinate and the dry bulb temperature (td) along the abscissa. The chart is normally constructed for a standard atmospheric pressure of 760 mm Hg or 1.01325 bar corresponding to the pressure at the mean sea level. A typical layout of this chart is shown in Fig. 20.5.
Some of the important lines on the psychrometic chart are explained below:
DBT lines: These lines are vertical, i.e. parallel to the ordinate and are uniformly, spaced. These lines are drawn at an interval of 5°C and up to the saturation line.
Specific humidity or moisture content lines: These lines are horizontal i.e parallel to the abscissa and are uniformly spaced.
DPT lines: These lines are horizontal, i.e. parallel to the abscissa and are non-uniformly spaced. At any point on the saturation line, the DBT and DPT are equal.
WBT lines: These are inclined straight lines and are non-uniformly spaced. At any point on the saturation line DBT and WBT are equal.
Enthalpy line: These are inclined straight lines and uniformly spaced. These lines are parallel to the WBT lines. The enthalpy values are given above the saturation line. Enthalpy deviation
(ws − w)hw is read form the deviation lines which are curved non-equally spaced with +ve and −ve correction.
Specific volume lines: These are obliquely inclined straight lines and are uniformly spaced.
Vapour pressure lines: These lines are horizontal and uniformly spaced. These lines are not drawn on the chart. A scale showing vapour pressure in mm of Hg is given on the extreme left or right side of the chart.
Relative humidity lines: These are curved lines and follow the saturated line. The saturation line represents 100% RH.
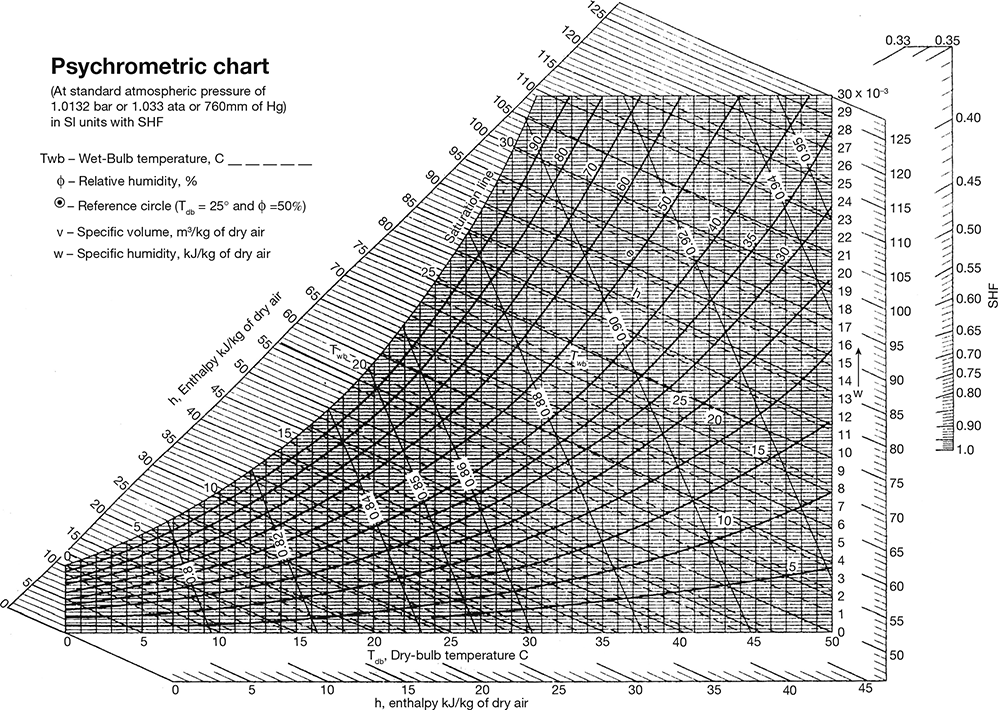
The psychrometric chart is shown in Fig. 20.6.
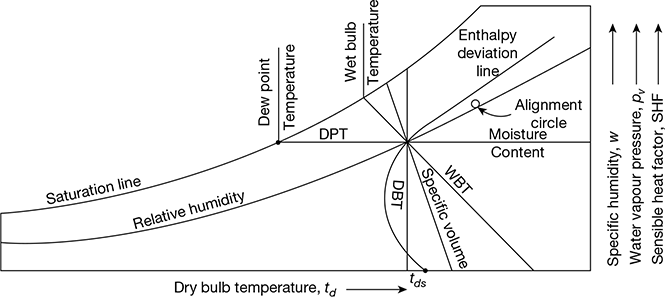
Figure 20.5 Layout of psychrometric chart
Leave a Reply