The T-s (Temperature-entropy) diagram for the vapour compression cycle is shown in Fig. 19.5.
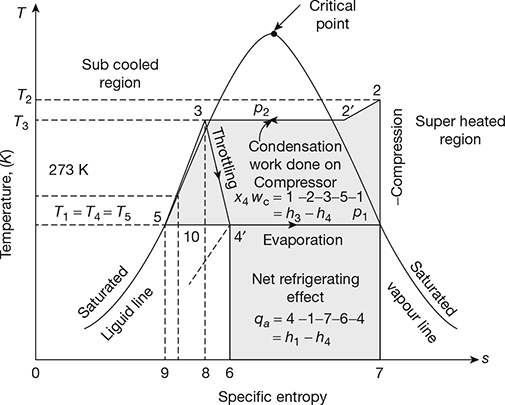
Figure 19.5 T-s diagram for vapour compression cycle
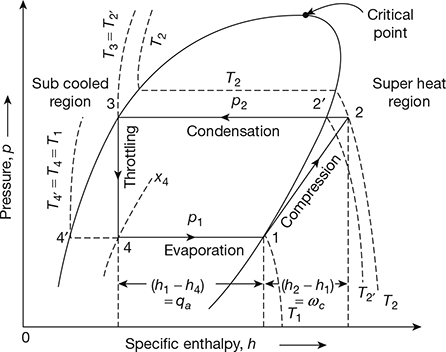
Figure 19.6 p-h diagram for vapour compression cycle
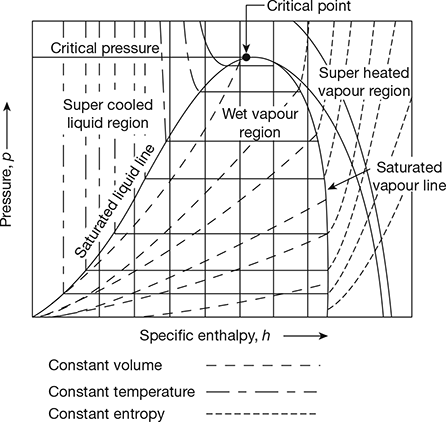
Figure 19.7 Pressure-enthalpy (p-h) chart
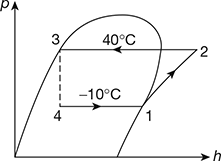
Process 1-2: Isentropic compression. State 1 represents saturated vapour and state 2 is super heated vapour.
Process 2-3: Condensation. State 2 represents saturated vapour and state 3 is saturated liquid. Heat is rejected to the condensing medium.
Process 3-4: Throttling process. The enthalpy of saturated liquid at state 3 is equal to the enthalpy at state 4 or 1.
Process 4-1: Evaporation. Heat is absorbed from the medium and refrigeration effect is produced.
The p-h (pressure-enthalpy) diagram is shown in Fig. 19.6. The various processes are also shown in this figure. The p-h chart is shown in Fig. 19.7. It is the most convenient chart for studying the behaviour of a refrigerant. The vertical ordinates represent pressure and horizontal ordinates represent enthalpy. The saturated liquid line and the saturated vapour line merge into one another at the critical point. The space to the left of the saturated liquid line is the sub-cooled liquid region. The space between the liquid and vapour lines is called the wet region. The space to the right of the saturated vapour line is the superheated vapour region.
Example 19.1
An R-12 vapour compression system is operating at a condenser temperature of 40°C and an evaporator temperature of −5°C. Calculate the Carnot COP and actual COP of the cycle.
Solution
From p-h diagram of R-12, we have
h1 = 185.4 kJ/kg, h2 = 208.0 kJ/kg, h3 = h4 = 74.6 kJ/kg
Actual ![]()
Example 19.2
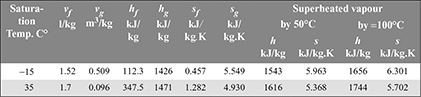
An ammonia refrigerating machine has working temperature of 35°C in the condenser and −15°C in the evaporator. Calculate the COP for (a) dry Compression, and (b) wet compression. The data for ammonia is given below:
Solution
- By interpolation for entropy,
 Degree of superheat at discharge = 50 + 27.1 = 77.1°CDischarge temperature = 35 + 77.1 − 112.1°C
 Refrigerating effect, Qa = h1 − h4 = 1426 − 347.5 = 1078.5kJ/kgWork done, W = h2 − h1 = 1685.4 −1426 = 259.4 kJ/kg
 h1 = 112.3 + 0.88(1426 −112.3) = 1268.4 kJ/kgv1 = vf1 + x1 (vg1 − vf1)= 0.00152 + 0.88(0.509 − 0.00152) = 0.448m3/kgQa = h1 − h4 = 1268.4 − 347.5 = 920.9 kJ/kgW = h2 − h1 = 1471−1268.4 = 202.6 kJ/kg
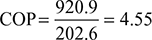
Example 19.3
A refrigerating plant using CO2 as refrigerant works between 25°C and −5°C. The dryness fraction of CO2 is 0.6 at the entry of compressor. Find the ice formed per day if the relative efficiency is 50%. Ice is formed at 0°C from water at 10° C. The quantity of CO2 circulated is 6 kg/min. For water cp = 4.187 kJ/kg, L = 335 kJ/kg.
Properties of CO2
| Temperature °C | hf kJ/kg | hfg kJ/kg | sf kJ/kg.K |
|---|---|---|---|
| 25 | 81.25 | 121.5 | 0.2513 |
| −5 | −7.53 | 254.8 | −0.04187 |
Solution
The T-s cycle is shown in Fig. 19.8.
T1 = 273 − 5 = 268K,
T2 = 273+ 25 = 298K
h1 = hf1 + x1hfg1 = −7.53 + 0.6 245.8
= 140 kJ/kg
s1 = s2
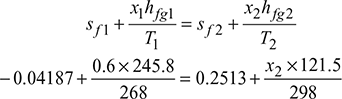
x2 = 0.63
h2 = hf2 + x2hfg2 = 81.25 + 0.63 × 121.5 = 157kJ/kg
Work done, w1−2 = h2 − h1 = 157−140 = 17kJ/kg
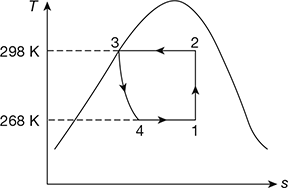
Figure 19.8 T-s diagram
Refrigerating effect, qa = h1 − h4 = h1 − h3 = h1 − hf3
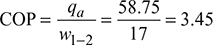
Actual COP = 3.45 × 0.5 = 1.725
Work done per second = ![]()
Actual cooling effect = 1.725 × 1.7 = 2.94 kJ/s
Heat carried to form 1 kg of ice
= cp (t2 − t1) + L = 4.187 ×10 + 335 = 376.87 kJ
Ice formed per hour = ![]()
Example 19.4
A refrigerator operating on a standard vapour compression cycle has a coefficient of performance of 6.5 and is driven by a 50 kW compressor. The enthalpies of saturated liquid and saturated vapour refrigerant at the operating condensing temperature of 35°C are 69.55 kJ/kg and 201.45kJ/kg respectively. The saturated refrigerant vapour leaving the evaporator has an enthalpy of 187.53kJ/kg. Find the refrigerant temperature at the compressor discharge. The cp of refrigerant vapour may be taken to be 0.6155kJ/kg.K.
Solution
COP = 6.5, Compressor power = 50 kW
Refrigerating capacity = 50 × 6.5 = 325 kW
Heat extracted per kg of refrigerant = 187.53 − 69.55 = 117.98 kJ/kg
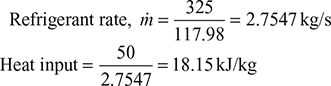
Enthalpy of vapour after compression = 187.53 + 18.15 = 205.68 kJ/kg
Superheat = 205.68 − 201.45 = 4.23 kJ/kg
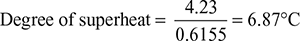
Temperature of refrigerant at compressor discharge = 35° + 6.87° = 41.87°C
Example 19.5
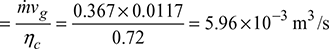
A refrigeration system of 15 tons capacity operates on standard simple vapour compression cycle using Refrigerant -22 to an evaporator temperature of 5°C and condensing temperature 50°C. Draw the p-h diagram for the cycle. Calculate (a) the refrigerant mass flow rate, and (b)the compressor intake volume flow rate if the compressor volumetric efficiency is 0.72. Use the refrigerant property data given in Table below.
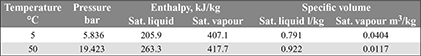
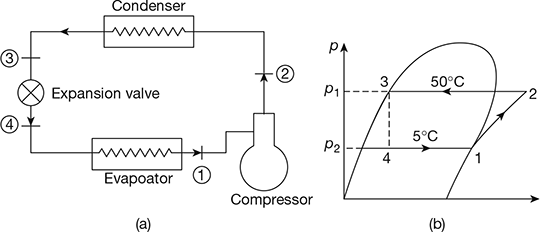
Figure 19.9 (a) Simple vapour compression system, (b) p-h diagram
Solution
Refer to Fig. 19.9.
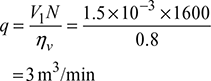
- Capacity of plant
 h1 = 407.1 kJ/kg,h4 = h3 − 263.3kJ/kg
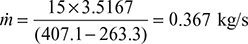
- Volume flow rate
Example 19.6
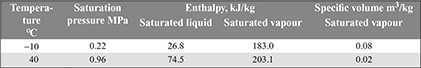
A refrigeration cycle uses Freon −12 as the working fluid. The temperature of the refrigerant in the evaporator is −10°C. The condensing temperature is 40°C. The cooling load is 150 W and the volumetric efficiency of the compressor is 80%. The speed of compressor is 720 rpm. Calculate the mass flow rate of the refrigerant and the displacement volume of the compressor.
Properties of Freon − 12
Solution
Cooling load Q = 150 W
Refrigeration effect = h1 − h4 (Fig.19.10)
= 183 − 74.5
= 108.5kj/kg
ṁ(h1 − h4) = Q
Mass flow rate of refrigerant,
Displacement volume of compressor,
Example 19.7
In a simple vapour compression cycle, following are the properties of the refrigerant R-12 at various points.
| Compressor inlet: | h1 = 183.2 kJ/kg, | v1 = 0.0767 m3/kg |
| Compressor discharge: | h2 = 222.6 kJ/kg, | v2 = 0.0164 m3/kg |
| Condenser exit: | h3 = 84.9 kJ/kg, | v3 = 0.0083 m3/kg |
The piston displacement volume for the compressor is 1.5 litres per stroke and its volumetric efficiency is 80%. The speed of the compressor is 1600 rpm.
Find (a) the power rating of the compressor (kW), (b) the refrigerating effect (kW).
Solution
Piston displacement volume (Fig. 19.11),
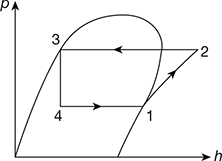
Figure 19.11 p-h diagram
Mass flow rate of compressor,
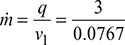
= 39.12kg/min
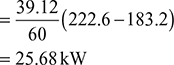
Power of compressor = ṁ(h2 − h1)
Refrigerating effect = ṁ(h1 − h4) = 39.12(183.2 − 84.9) = 3845.5 kJ/min or 64.1kW
Example 19.8
In a standard vapour compression refrigeration cycle operating between an evaporator temperature of −10°C and condenser temperature of 40°C, the enthalpy of the refrigerant, Freon-12, at the end of compression is 220 kJ/kg. Show the cycle diagram on T-s plane.
Calculate (a) the COP of the cycle, (b) the refrigerating capacity and the compressor power assuming a refrigerant flow rate of 1 kg/min. You may use the extract of the Freon-12 property table given below:
| t(°C) | p(MPa) | hf(kJ/kg) | hg(kJ/kg) |
|---|---|---|---|
| −10 | 0.2191 | 26.85 | 183.1 |
| 40 | 0.9607 | 74.53 | 203.1 |
Solution
The T-s diagram is shown in Fig. 19.12
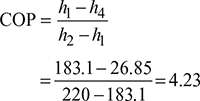
Refrigerating capacity
= ṁ (h1 − h4)
= 1(183.1 − 26.85)
= 156.25 kJ/min or 2.6 kW
Compressor power = ṁ (h2 − h1)
= 1 (220 − 183.1)
= 36.9 kJ/min or 0.615 kW
Example 19.9
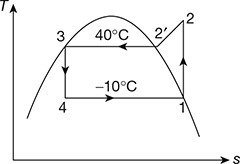
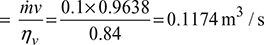
An R-717 (ammonia) system operates on the basic vapour compression refrigeration cycle. The evaporator and condenser pressures are 0.119 MPa and 1.389 MPa respectively. The mass flow rate of refrigerant is 0.1 kg/s. The volumetric efficiency of the compressor is 84%. Determine the compressor displacement rate. If the COP of the cycle is 2, determine the power input to the compressor.
Saturation Properties of R-717 (ammonia)
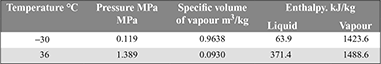
Solution
Compressor displacement (Fig. 19.13)
Refrigerating effect = h1 − h4
= 1423.6 − 371.4
= 1052.2 kJ/kg
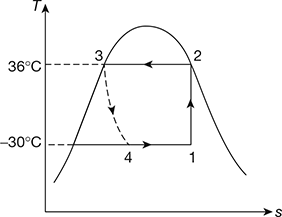
Figure 19.13 T-s diagram

Power input to compressor = 526.1 × 0.1 = 52.61 kW
Example 19.10
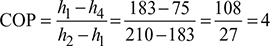
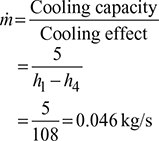
In a 5 kW cooling capacity refrigeration system operating on a simple vapour compression cycle, the refrigerant enters the evaporator with an enthalpy of 75 kJ/kg and leaves with an enthalpy of 183 kJ/kg. The enthalpy of the refrigerant after compression is 210 kJ/kg. Show the cycle on T-s and p-h diagrams. Calculate the following: (a) COP, (b) power input to compressor, and (c) rate of heat transfer at the condenser.
Solution
Refer to Fig. 19.14.
Mass flow rate of refrigerant,
Power input to compressor,
= ṁ(h2 − h1)= 0.046 (210 − 183) = 1.24 kW
Rate of heat transfer to condenser,
Qr = ṁ(h2 − h4)
h4 = h3
Qr = 0.046 (210 − 75) = 6.21 kW
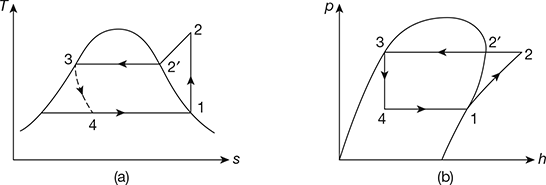
Figure 19.14 (a) T-s diagram, (b) p-h diagram
Example 19.11
An ice making plant using refrigerant R-12 is having an evaporator saturation temperature of −25°C and the condenser saturation temperature of 35°C. The vapour is leaving the compressor at 65°C. Following table shows the properties of the refrigerant:
Enthalpy of superheated refrigerant at 850 kPa and 65°C = 225.5 kJ/kg
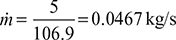
- Calculate the coefficient of performance (COP) of this system.
- If the capacity of the plant is 5 kW, calculate mass flow rate of refrigerant and power consumption.
Solution
Refer to Fig. 19.15.
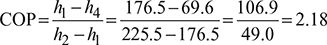
- ṁ (h1 − h1) = 5
Power consumption = ṁ (h2 − h1)
= 0.0467 × 49 = 2.288 kW
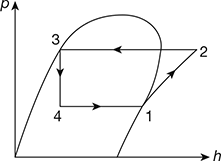
Figure 19.15 p-h diagram
Leave a Reply