A schematic diagram of a vapour compression refrigeration system is shown in Fig. 19.2. It consists of a compressor, condenser, expansion device for throttling and an evaporator. In plants with a large amount of refrigerant charge, a receiver and a drier is installed in the liquid line. The p-v, T-s, and p-h diagrams for the system are shown in Fig. 19.3. The sequence of operations is as given below:
- The process 1-2 is isentropic compression.s2 = s1, Q = 0. Work done by the compressor per kg of refrigerantW1-2 = −∫ v dp = −∫ dh = −(h2 − h1)
- The process 2-3 is constant pressure condensation.Heat rejected, Qr = h2−h3
- The process 3-4 is isenthalpic expansion.h3 = h4 = hf4 + x(h1 − hf4)or Dryness fraction,

- The process 4-1 is constant pressure evaporation. Refrigeration effect or Heat absorbed,Qa = h1 − h4


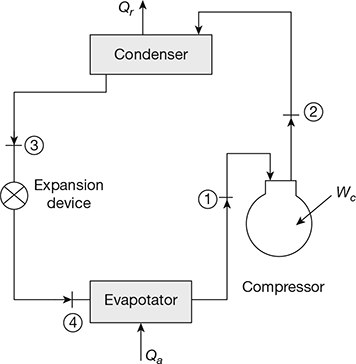 Figure 19.2 Vapour compression system
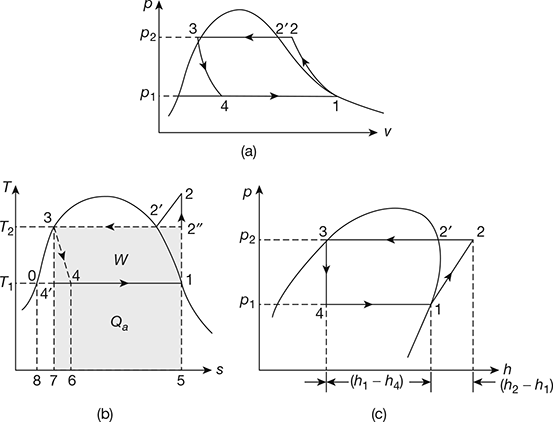
Figure 19.3 Vapour compression cycle: (a) p-v diagram, (b) T-s diagram, (c) p-h diagram
- From Fig. 19.3(b), we have for vapours dry and saturated at the beginning of compression and superheated at the end of compression.Refrigerating effect, Qa = area 1–4−6−5−1Heat rejected, Qr = area 2−2′−3−7−5−2Work done, W = Qr − Qa= area 1−2−2′−3−7−6−4−1Area 4−4′−7−6−4 = area 3−0−4′−3
- When vapours are dry and saturated at the end of compression, as shown in Fig. 19.4.Work done = area 1−2−3−0−1 = Heat at 2 − Heat at 1 = h2 − h1Refrigeration effect = area 1−4−6−5 = Heat at 1 − Heat at 4 = h1 − h4Area 3−0−4′−3 = area 4−4′−7−6−4∴ Work done, W = area 1−2−3−7−6−4−1Dryness fraction at suction,
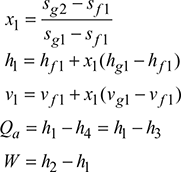

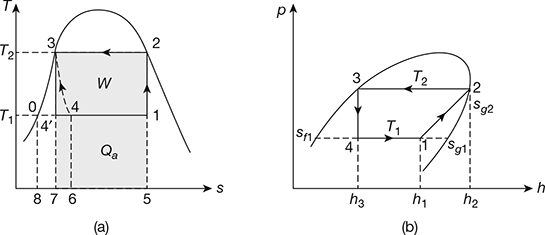
Figure 19.4 Vapour compression cycle: (a) T-s diagram, (b) p-h diagram
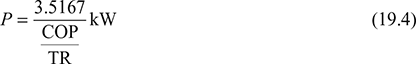
The COP of vapour compression cycle is lower than that of reversed Carnot cycle. Power per ton of refrigeration,


where v1 = specific volume of the refrigerant at the inlet of compressor

D = dia of compressor piston or cylinder
L = stroke length
N = rpm
n = number of cylinders in compressor
ηv = volumetric efficiency
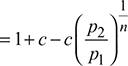
c = clearance ratio
Mass flow rate of cooling medium in the condenser:

Leave a Reply