The performance of a CI engine at constant speed and variable load is shown in Fig. 11.7. As the efficiency of the CI engine is more than the SI engine, the total losses are less. The coolant loss is more at low loads and radiation and other losses are greater at high loads. The BMEP, BP, and torque directly increase with load, as shown in Figs. 11.8(a) and (b). Unlike the SI engine, the BP and BMEP are continuously rising curves and are limited only by the smoke. The exhaust temperature is also nearly proportional to the load. The lowest BSFC and hence the maximum efficiency occurs at about 80% of the full load.
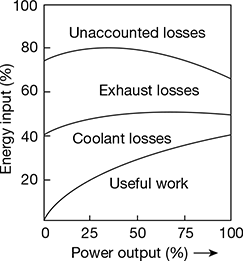
Figure 11.7 Heat balance diagram for a typical CI engine
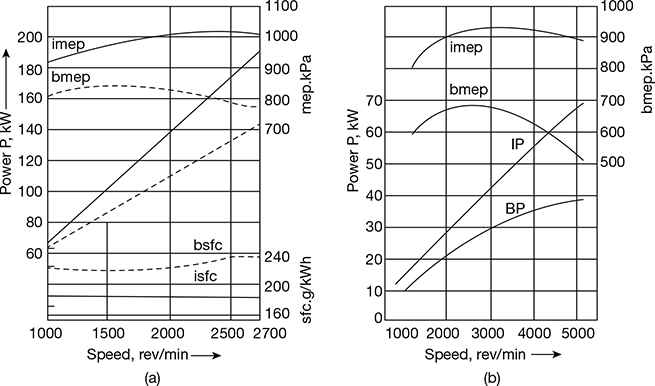
Figure 11.8 IP, BP, IMEP, BMEP, and SFC for a CI engine
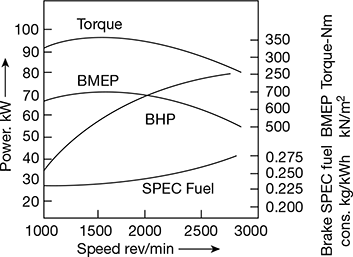
Figure 11.9 Performance curves of a diesel engine
Figure 11.9 shows the performance curves of a variable speed GM 7850 cc four cycle V-6 Toro-flow diesel engine. The maximum torque value is at about 70% of maximum speed compared to about 50% in the SI engine. In addition, the BSFC is low through most of the speed range for the diesel engine and is better than the SI engine.
Leave a Reply