The performance of an engine is generally given by a heat balance sheet. The main components of a heat balance sheet are (i) heat equivalent to the effective (brake) work of the engine, (ii) heat rejected to the cooling medium, (iii) heat carried away from the engine with the exhaust gases, and (iv) unaccounted losses. The unaccounted losses include the radiation losses from the various parts of the engine and heat loss due to incomplete combustion. The friction loss is not shown as a separate item as it ultimately reappears as heat in cooling water, exhaust, and radiation.
Figure 11.2 shows the heat balance sheet for a petrol engine run at full throttle over its speed range. In SI engines, the loss due to incomplete combustion included in unaccounted losses can be rather high. For a rich mixture (A /F ratio 12.5:13) it could be 20%. Figure 11.3 shows the heat balance of an uncontrolled SI engine at different loads.
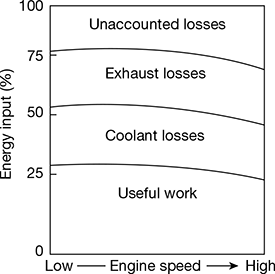
Figure 11.2 Heat balance diagram for a typical SI engine
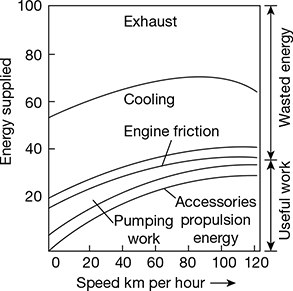
Figure 11.3 Uncontrolled SI engine
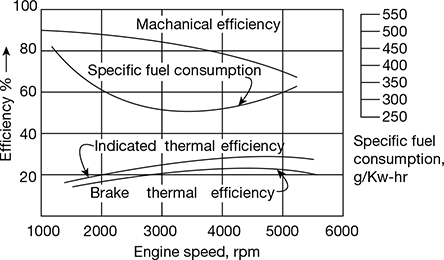
Figure 11.4 Efficiency and specific fuel consumption vs speed for a SI engine at full throttle
Figure 11.4 shows the brake thermal efficiency, indicated thermal efficiency, mechanical efficiency, and specific fuel consumption for the above SI engine.
Figures 11.5 (a) and (b) show the indicated power (IP), brake power (BP), and friction power (FP) (by difference), brake torque, brake mean effective pressure, and brake specific fuel consumption of a high compression ratio (r) automotive SI engine at full or wide open throttle (WOT).
The following conclusions can be drawn from the above figures:
- At full throttle, the brake thermal efficiency at various speeds varies from 20%–27%, maximum efficiency being at the middle speed range.
- The percentage heat rejected to a coolant is more at lower speed (>> 35%) and reduces at higher speeds (>> 25%). Considerably more heat is carried by the exhaust at higher speeds.
- Torque and mean effective pressure (MEP) do not strongly depend on the speed of the engine but depend on volumetric efficiency and friction losses. Maximum torque position corresponds with the maximum air charge or maximum volumetric efficiency position.Torque and MEP curves peak at about half that of the brake power.
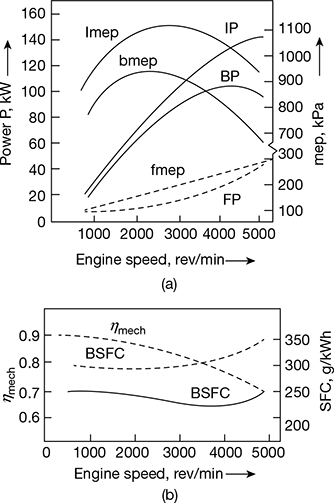 Figure 11.5 Variable speed test of automotive SI engine at full throttle (CR = 9): (a) Power, mep vs engine speed, (b) ηmech, SFC vs engine speedNote: If size (displacement) of the engine were to be double, torque would also double, but MEP is a ‘specific’ torque—a variable independent of the size of the engine.
 - High brake power arises from high speed. In the speed range before the maximum brake power is obtained, doubling the speed doubles the power.
- At low engine speed, the frictional power is relatively low and brake power is nearly as large as indicated power. As engine speed increases, however, friction power increases at continuously greater rate and therefore, brake power reaches a peak and starts reducing even though indicated power is increasing. At engine speeds above the usual operating range, friction power increases very rapidly. At these higher speeds, indicated power will reach a maximum and then fall off. At some point, indicated power and friction power will be equal, and brake power will then drop to zero.
1 Performance of SI Engine at Constant Speed and Variable Load
The performance of an SI engine at constant speed and variable load is different from the performance at full throttle and variable speed. Figure 11.6 shows the heat balance of an SI engine at constant speed and variable load. The load is varied by altering the throttle and the speed is kept constant by resetting the dynamometer.
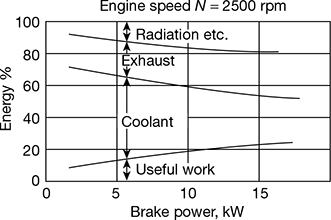
Figure 11.6 Heat balance vs load for a SI engine
Closing the throttle reduces the pressure inside the cylinders but the temperature is affected very little because the air /fuel ratio is substantially constant, and the gas temperatures throughout the cycle are high. This results in high loss to coolant at low engine loads.
At low loads, the efficiency is about 10%, rising to about 25% at full load. The loss to the coolant is about 60% at low loads and 30% at full load. The exhaust temperature rises very slowly with load and as the mass flow rate of exhaust gas is reduced because the mass flow rate of fuel into the engine is reduced, the percentage loss to exhaust remains nearly constant (about 21% at low loads to 24% at full load). Percentage loss to radiation increases from about 7% at low loads to 20% at full load.
Leave a Reply