The comparison parameters selected are:
- Equal compression ratio and heat input.
- Constant maximum pressure and heat input.
- Constant maximum pressure and work output.
- Constant maximum pressure and temperature.
- Equal compression ratio and heat rejection.

Figure 9.14 Comparison for equal compression ratio and heat input:
(a) p-v diagram, (b) T-s diagram
- Equal compression ratio and heat input. The p-v and T-s diagrams for the three cycles are shown in Fig.9.14. The cycles have been represented as follows:
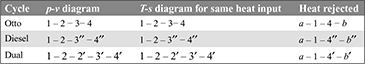
- That cycle will be more efficient which rejects the least amount of heat after expansion, because
 Thus the order of efficiencies is:
- Constant maximum pressure and heat input. The p-v and T-s diagrams for Otto and Diesel cycles are shown in Fig. 9.15 for constant maximum pressure and heat inputArea a – 2 − 3 – b = Area a – 2′ – 3′ –b′ for same heat input.

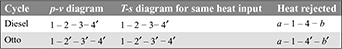
- Thus cycle will be more efficient that rejects the least amount of heat.(Area a – 1 − 4 –b) < (Area a – 1 – 4′ –b′)Thus the Diesel cycle is more efficient than the Otto cycle. A similar argument will show that the dual cycle performance falls between the other two. Thus

 Figure 9.15 Comparison for equal maximum pressure and heat input:
(a) p-v diagram, (b) T-s diagram - Constant maximum pressure and work output. The p-v and T-s diagrams are shown in Fig. 9.15 for maximum pressure and output.
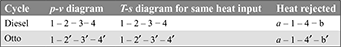
- Area 1 – 2 – 3 – 4 = Area 1 – 2′ – 3′ – 4′ for same work output
 The cycle will be more efficient which rejects least amount of heat.(Area a – 1 – 4 – b) < (Area a – 1′ – 4′ – b′)Hence the Diesel cycle is more efficient than the Otto cycle. Thus
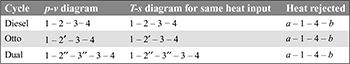
- Constant maximum pressure and temperature. The p-v and T-s diagrams are shown in Fig. 9.16 for same maximum pressure and temporal are.
 Now
Now 
 Figure 9.16 Comparison for equal maximum pressure and temperature: (a) p-v diagram, (b) T-s diagramAll the cycles reject equal amount of heat.Thus cycle will be more efficient which has higher heat addition.Hence, the Diesel cycle is more efficient than the Otto cycle. Thus
- Equal compression ratio and heat rejection. The p-v and T-s diagrams are shown in Fig. 9.17, for equal compression ratio and heat rejectionFor same qr, if qs is more, η is more.

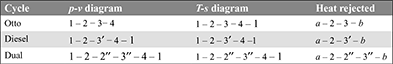

Figure 9.17 Comparison for equal compression ratio and heat rejection: (a) p-v diagram, (b) T-s diagram
Example 9.1
A Carnot cycle has lowest temperature and pressure of 20°C and 1 bar. The pressures are: 4 bar after isothermal compression; 12 bar after isentropic compression and 6 bar after isothermal heat addition. Calculate (a) the highest temperature in the cycle, (b) thermal efficiency of the cycle, (c) mean effective pressure, and power developed with 150 cycles per minute.
Solution
Given: p4 = 1 bar, T2 = 293 K, p2 = 12 bar, p1 = 4 bar, p3 = 6 bar (Refer to Fig. 9.2)

Stroke volume, vs= v4 – v2 = 0.8409 – 0.0958 = 0.7451 m3/kg
- Highest temperature in the cycle,

- Heat supplied,
 = 79.67 kJ/kgHeat rejected,
  = − 58.07 kJ/kgNet work done, wnet = qs – qr = 79.67 – 58.07 = 21.60 kJ/kgThermal efficiency,
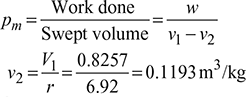
- Mean effective pressure =

- Power developed = wnet × rpm/60 = 21.6 × 150/60 = 54 kW.
Example 9.2
The following particulars refer to an engine working on Stirling cycle.
Compression ratio = 3, lower temperature = 30°C, speed = 50 rpm, higher temperature = 550°C, regenerative efficiency =90%, initial pressure = 1 bar, heat added = 2300 kJ/min.
Calculate (a) work done per kg, (b) thermal efficiency, (c) mean effective pressure, and (d) indicated power.
Solution
Refer to Fig. 9.18.
- Work done = R(T1 – T2) ln r= 0.287 (823 – 300) ln 3= 163.956 kJ/kgHeat added = RT1 ln r + (1 – ηreg) cv(T1 – T2)= 0.287 × 823 × ln 3 + (1 – 0.9) × 0.718 × (823 – 303)= 296.829 kJ/kg
- Thermal efficiency


- Air flow rate

- Working cycles/min =
 Mass of air per working cycle,

 Figure 9.18Stroke volume Vs = V1 − V2 = 0.2694 − 0.0898 = 0.1796m3Mean effective pressure,
- Indicated power

Example 9.3
An engine working on Atkinson cycle takes in air at 1 bar and 25°C. The air is compressed isentropically by a compression ratio of 6:1. The heat is added at constant volume increasing the final pressure to 20 bar. Now, the air is expanded isentropically to 1 bar. The heat is rejected at constant pressure Calculate (a) pressure and temperature at various points, (b) work done per kg of air, and (c) cycle efficiency
Solution
Refer to Fig. 9.19.
- p1 = 1 bar,T1 = 25+ 273 = 298 KT2 = T1rγ – 1 = 298 ×60.4 = 610.2 Kp2 = p1rγ = 1 × 6 1.4 = 12.286 barp3 = 20 bar
 Heat added, qs = cv(T3 – T2) = 0.718 (993.3 – 610.2) = 279.4 kJ/kgHeat rejected, qr = cp(T4 – T1) = 1.005 (422.7 – 298) = 124.7 kJ/kg
 - Work done, w = qs − qr = 279.4 – 124.7 = 154.7 kJ/kg
- Thermal efficiency =

 Figure 9.19
Example 9.4
In an engine working on ideal Otto cycle, the temperature at the beginning and end of compression are 45° C and 370°C. Find the compression ratio and air standard efficiency of the engine.
Assume γ = 1.4.
Solution
Refer to Fig. 9.6.
- Compression, ratio,


- Air standard efficiency,

Example 9.5
In an Otto cycle, air at 15°C and 1 bar is compressed adiabatically until the pressure is 15 bar. Heat is added at constant volume until the pressure rises to 40 bar. Calculate (a)the air-standard efficiency, (b) the compression ratio, and (c) the mean effective pressure for the cycle. Assume cv = 0.718 kJ/kg. K, γ = 1.4 and R = 8.314 kJ/kmol.K.
Solution
The Otto cycle is shown in Fig. 9.20.
For isentropic process 1 – 2,
p1v1γ = pv2γ
Compression ratio, 
Air standard efficiency,


Figure 9.20
For constant volume process 2 – 3:
![]()
Heat supplied qs = cv(T3 – T2) = 0.718 (1669.7 – 629.3) = 747.03 kJ/kg
Work done, w = ηa qs = 0.539 × 747.03 = 402.65 kJ/kg
Mean effective pressure,
Specific volume, v1 – v2 = 0.7064 m3/kg

Example 9.6
A gas engine working on Otto cycle has a cylinder of diameter 220 mm and stroke 300 mm. The clearance volume is 1600 cc. Find the air standard efficiency.
Assume cp = 1.004 kJ/kg. K and cv = 0.718 kJ/kg.K for air.
Solution
Swept volume,

Compression ratio, ![]()
Adiabatic index, ![]()
Air standard efficiency,

Example 9.7
The pressure limit in an Otto cycle are 1 bar and 20 bar. The compression ratio is 5. Calculate (a) thermal efficiency and (b) mean effective pressure. Assume γ = 1.4 for air.
Solution

- From Fig. 9.6, we have
 p2 = 1 × 9.5182 = 9.5182 barp3 = 20 bar
Pressure Ratio, 
Example 9.8
A petrol engine with compression ratio of 5 develops 20kW indicated power and consumes 8 litres of fuel per hour. The specific gravity of fuel is 0.78 and its calorific value is 44 MJ/kg. Calculate the indicated thermal efficiency and relative efficiency. Take = γ 1.4.
Solution
Air standard efficiency,

Fuel consumption = 8 × 0.78 × 1 = 6.24 kg/h

Indicated thermal efficiency,

Relative efficiency ![]()
Example 9.9
A diesel engine has a compression ratio of 20 and cut-off takes place at 5% of the stroke. Find the air-standard efficiency. Assume γ = 1.4.
Solution
Refer to Fig. 9.8.

Cut-off ratio, ![]()

Example 9.10
A diesel cycle operates at a pressure of 1 bar at the beginning of compression and the volume is compressed to ![]() th of the initial volume. Heat is supplied until the volume is twice that of the clearance volume. Calculate the mean effective pressure of the cycle. Assume γ = 1.4.
th of the initial volume. Heat is supplied until the volume is twice that of the clearance volume. Calculate the mean effective pressure of the cycle. Assume γ = 1.4.
Solution
With reference to Fig. 9.8,

Swept volume, vs = v1 − v2 = (r −1) v2 = (15−1) v2 =14 v2
or ![]()
Process 1–2:

p2 = p3 = 49.31 bar


= 0.071 [49.31 + 122.55 – 79.27] = 6.685 bar
Example 9.11
The mean effective pressure of an ideal diesel cycle is 10 bar. If the initial pressure is 1 bar and the compression ratio is 14, determine the cut off ratio and the air standard efficiency. Assume γ = 1.4.
Solution
See Fig. 9.8.
Work output ![]()


Work done per cycle

or f (ρ) = ρ1.4 − 9.024ρ + 6.738 = 0
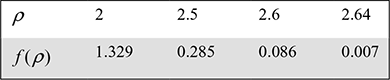
We take ρ = 2.64

Example 9.12
In an engine working on the diesel cycle, the air-fuel ratio by weight is 50:1. The temperature of air at the beginning of combustion is 40°C and the compression ratio is 19. What is the ideal efficiency of the engine. Calorific value of fuel is 42 MJ/kg. Assume cv = 0.717 kJ/kgK, cp = 1.004 kJ/kgK.
Solution
Refer to Fig. 9.8.

Process 1 – 2: 
T2 = 929.66 K
Process 2 – 3: ![]()

Example 9.13
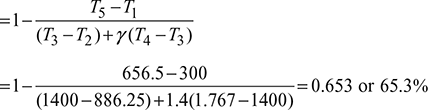
An air standard diesel cycle has a compression ratio of 16. The pressure at the beginning of compression stroke is 1 bar and the temperature is 20°C. The maximum temperature is 1430°C. Determine the thermal efficiency and the mean effective pressure for this cycle. Take γ = 1.4.
Solution
Refer to Fig. 9.8.

Process 2 – 3: ![]()

Example 9.14
An engine works on dual combustion cycle, the compression ratio being 11. The pressure at the commencement of combustion is 1 bar and the temperature is 90°C. The maximum pressure in the cycle is 50 bar and the constant pressure heat addition continues for ![]() of the stroke. Calculate the work done per kg of air and the ideal thermal efficiency. Assume, cv = 0.718 kJ/kgK, cp = 1.005 kJ/kgK.
of the stroke. Calculate the work done per kg of air and the ideal thermal efficiency. Assume, cv = 0.718 kJ/kgK, cp = 1.005 kJ/kgK.
Solution

T1 = 90 + 273= 363K
Refer to Fig. 9.21. ![]()


Process 1 – 2: T2 = T1r0.4 = 363 × 110.4 = 947.24K
p2 = p1rγ = 1 × 11 = 28.704 bar
Process 2 – 3: ![]()
Process 3 – 4: 
Process 4 – 5: 
w = qs − qr = cv (T3 − T2) + cp (T4 − T3) − cv (T5 – T1)
= [0.718(1650 – 947.24) + 1.005(2475 – 1650)] – 0.718 (1119.46 – 363)
= 1339.70 – 360.26 = 979.4 kJ/kg

Example 9.21
A gas turbine operates on Brayton cycle with in takes air at 1 bar and 15°C. The air is compressed to 15 bar and heated in a combustion chamber to 800°C. The hot air expands in the turbine to 1 bar. Find (a) the power developed, (b) thermal efficiency of the cycle. Take γ = 1.4 and cp = 1.005 kJ/kgK.
Solution
Refer to Fig. 9.22
T1 = 15 + 273 = 288K

Compressor work, wc = cp (T2 – T1) = 1.005(456.14 – 288) = 168.98 kJ/kg

Turbine work, wt = h3 − h4 = cp (T3 − T4)
= 1.005(1073 – 677.47) = 397.5 kJ/kg
Heat added, qs = q2-3 = h3 − h2 = cp (T3 − T2)
= 1.005 (1073 – 456.14) = 619.94 kJ/kg
Network, w = wt − wc = 397.5 − 168.98 = 228.52 kJ/kg

Power output = 228.52 kJ/kg
Example 9.15
Prove that the optimum pressure ratio rp for maximum net-work done between the temperature T1 and T3 for a Brayton cycle is given by:

Solution
From Fig. 9.22, we have


Net-work done/kg of air,
w = (h3 – h2) − (h4 – h1) = cp (T3 – T2) − cp (T4 – T1)
= cp (T3 – T4) − cp (T2 – T1) = cp T3(1 – 1/x) − cp T1 (x − 1)
or 

Here y is constant and x is variable,

Example 9.16
An air-standard Brayton cycle has pressure ratio across the compression equal to 6. Air enters the compressor at 1 bar and 27°C. The maximum temperature of the cycle is 850°C. Calculate the specific output of the cycle. What will be the power/developed by the unit for a mass flow rate of 10 kg/s. For air, γ = 1.4 and cp = 1.005 kJ/kg.K.
Solution
From Fig. 9.12, we have

Specific output, w = cp (T3 – T2) – cp(T4 – T1)
= 1.005 [(1123 – 500.8) – (672.86 – 300)] = 250.58 kJ/kg
Power developed, P = mw = 10 × 250.58 = 2505.8 kW
Example 9.17
In an I.C. engine operating on the dual cycle (limited pressure cycle), the temperature of the working fluid (air) at the beginning of compression is 27°C. The ratio of the maximum and minimum pressures of the cycle is 70 and the compression ratio is 15. The amounts of heat added at constant volume and at constant pressure are equal. Compute the air standard thermal efficiency of the cycle.
Solution
The p-v diagram for the dual cycle is shown in Fig. 9.23.
T1 = 273 + 27 = 300 K

Process 2 – 3: ![]()
Now cv (T3 −T2) = cp (T4 − T3)

Process 3 – 4: ![]()
Also v5 = v1
Process 4 – 5: 

Figure 9.23 Dual cycle on p-v diagram
Example 9.18
In an air-standard Brayton cycle the minimum and maximum temperatures are 300 K and 1200 K, respectively. The pressure ratio is that which maximizes the network developed by the cycle per unit mass of air flow. Calculate the compressor and turbine work, each in kJ/kg air, and the thermal efficiency of the cycle.
Solution
With reference to Fig. 9.25, Tmax = 1200 K and Tmin = 300 K
For maximum work, optimum pressure ratio,

Compressor work,
wc = cp (T2 − T1)
= 1.005(600 – 300) = 301.5 kJ/kg
Turbine work, wt = cp (T3 − T4) = 1.005(1200 − 600)= 603kJ/kg
Heat supplied, Qs = cp (T3 −T2) = 1.005(1200 − 600) = 603kJ/kg
Thermal efficiency, ![]()

Figure 9.25 Brayton cycle on T-s diagram
Example 9.19
Derive an expression for air standard efficiency of the following cycle in terms of compression ratio R, cv and γ.
- an isothermal compression, compression ratio, r
- an increase of pressure at constant volume.
- an adiabatic expansion.[IES, 1997]
Solution
The p-v diagram is shown in Fig. 9.28
Process 1 – 2: Isothermal compression

Process 2 – 3: Constant volume process

Process 3 – 1: Adiabatic expansion
W3−1 = mcv (T3 −T1)
Q3−1 = 0
Air standard efficiency,
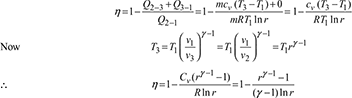
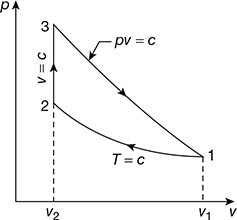
Figure 9.28 p-v diagram
Example 9.20
An air standard Otto cycle has a volumetric compression ratio of 6, the lowest cycle pressure of 0.1 MPa and operates between temperature limits of 27°C and 1569°C.
- Calculate the temperature and pressure after the isentropic expansion (Ratio of specific heats = 1.4).
- Since it is observed that values in (a) are well above the lowest cycle operating conditions, the expansion process was allowed to continue down to a pressure of 0.1 MPa. Which process is required to complete the cycle? Name, the cycle so obtained.
- Determine by what percentage the cycle efficiency has been improved.[GATE 1994]
Solution
The p-v diagram is shown in Fig. 9.29.

p1 = 0.1MPa
T1 = 27+ 273= 300K
T3 =1569+ 273=1842K


 Figure 9.29 Otto cycle
- Constant pressure scavenging is required to complete the cycle with expansion process to continue down to 0.1 MPa as shown in Fig. 9.30. The cycle is called Atkinson cycle.


 Improvement in cycle efficiency = 59.25 – 51.16 = 8.09%

Figure 9.30 Atkinson cycle
Example 9.21
Air enters the compressor of a gas turbine plant operating on Brayton cycle at 1 bar, 27°C. The pressure ratio in the cycle is 6. If Wt = 2.5 Wc where Wt and Wc are the turbine and compressor work respectively, calculate the maximum temperature and tin cycle efficiency.
Solution
The Brayton cycle is shown in Fig. 9.31
p1 = 1bar = 1 × 10⁵ N/m2
T1 = 27+ 273 = 300K


Cycle efficiency ![]()

Example 9.22
The minimum pressure and temperature in an Otto cycle are 100 kPa and 27°C. The amount of heat added to the air cycle is 1500 kJ/kg. Determine the pressure and temperatures at all points of the air standard Otto cycle. Also calculate the specific work and the thermal efficiency of the cycle for a compression ratio 8:1. (Take cv (air) = 0.72 kJ/kg K and (cp/cv)air = 1.4).
Solution
The Otto cycle is shown in Fig. 9.32

Figure 9.32 Otto cycle

Specific work, wnet = q2−3 − q4−1 = 1500 −652.91=847.09 kJ/kg
Example 9.23
A Brayton cycle (air standard) has a pressure ratio of 4 and inlet conditions of one standard atmospheric pressure and 27°C. Find the air flow rate required for 100 kW power output if the maximum temperature in the cycle is 1000°C. Assume γ = l.4 and cp = l.0 kJ/kg K.

Figure 9.33 Brayton cycle
Solution
Refer to Fig. 9.33.

Example 9.24
Calculate the percentage loss in the ideal efficiency of a diesel engine with compression ratio 14 if the fuel cut-off is delayed from 5% to 8%.
Solution
The diesel cycle is shown in Fig. 9.34
Compression ratio, r = 14, Cut-off ratio, ρ = 0.05

Change in efficiency


Figure 9.34 Diesel cycle
Example 9.25
A reciprocating engine works on Otto cycle where the temperature at the beginning and end of the compression stroke are found to be 40°C and 360°C respectively. Assuming the ratio of specific heats at constant pressure and constant volume to be 1.4, determine the air standard efficiency and the compression ratio.
Solution
The p-v diagram is shown in Fig. 9.35
T1 = 273+ 40 = 313K
T2 = 273+ 360 = 633K
Process 1 – 2:
Compression ratio, 
Air-standard efficiency ![]()

Figure 9.35 p-v diagram for Otto cycle
Example 9.26
An engine working on the ideal Otto cycle takes in air at 1 bar and 30°C which is compressed to 15 bar at the end of the compression stroke. The temperature attained at the end of constant volume heat addition is 900°C. Assuming adiabatic index to be 1.4, determine (a) the compression ratio, (b) the thermal efficiency, (c) the temperature at the end of compression, (d) the pressure at the end of constant volume heating, and (e) the mean effective pressure.
Solution
The p-v diagrams are shown in Fig. 9.37.
p1 = 1bar, T1 = 273 + 30 = 303K
p2 = 15 bar, T3 = 273 + 900 = 1173K, γ = 1.4
- Compression ratio,

- Thermal efficiency,


- Mean effective pressure,

Figure 9.37 p – v diagram for Otto cycle

Example 9.27
The diameter and stroke of a gas engine cylinder are 18 cm and 30 cm respectively. The ratio of expansion is 5. The pressure and temperature of the mixture at the beginning of compression are 1 bar and 100°C respectively. Find the index of the compression process and the weight of the mixture in the cylinder, if the pressure at the end of compression is 7 bar. Also calculate the work done and heat transferred during the process, indicating the direction of flow. Assume R = 0.287 kJ/kg K and ratio of specific heats equal to 1.4 for the mixture. Take 1 bar = 100 kPa.
Solution
The p-V diagram is shown in Fig. 9.38


Figure 9.38

Work done 

Heat added, 
Now ![]()

− ve sign indicates that heat is rejected by the system.
Example 9.28
A four-stroke limited pressure cycle (diesel) engine draws 1.2 kg/s of air at 1 atm and 27°C. Compression ratio of the cycle is 16. Pressure ratio during constant volume heat addition is 2.0. Total heat added is equal to 2310 kJ/kg of air in the cylinder. Determine
- pressure, volume and temperature at all salient points,
- % of heat added during constant pressure process,
- cut-off ratio,
- thermal efficiency, and
- mean effective pressure.
Represent the cycle on p-v and T-s planes.
Assume cp = 1.005 kJ/kg.K and cv = 0.718 kJ/kg.K
Solution
The p-v and T-s diagrams are shown in Fig. 9.39.


 Figure 9.39 Limited pressure cycle (diesel) 4-stroke engine: (a) p-v diagram, (b) T-s diagram
 Heat added,
- Heat added during constant pressure process, qp = cp (T4 − T3) = 1.005 (3467.64 − 1818.86) = 1657.024 kJ/kg Percentage of heat added =

- Cut-off ratio,

- Thermal efficiency,
 Heat rejected during process 5 – 1
- Mean effective pressure,

Example 9.29
A reversible cycle using an ideal gas as the working substance consists of an isentropic compression from an initial temperature to 555 K, a constant volume process from 555 K to 835 K, a reversible adiabatic expansion to 555 K, a constant pressure expansion from 555 K to 835 K, followed by constant volume process to the initial temperature. Draw the cycle on p-v amd T-s diagrams and determine the initial temperature. Take γ = 1.40. Also compute the work done.
Solution
The p-v and T-s diagrams are shown in Fig 9.40 (a) and (b) respectively.
Process 1 – 2: 
Process 3 – 4: 
Process 4 – 5: ![]()
Now ![]()

Work done ![]()


Figure 9.40 (a) p-v diagram, (b) T-s diagram
Leave a Reply