16.6.1 Community Noise Ordinances
The major sources of noise in the community are caused by surface transportation, aircraft/airports, industry, and construction [72–80]. As discussed in this part of the book, the main contribution to community noise, in most countries, is caused by road and rail traffic. The annoyance caused by noise depends upon the level, duration, time of day, frequency content, and other factors. Road traffic noise depends upon the road surface, road inclination, traffic density, and mix, and speed of automobiles and light and heavy trucks. Railroad noise depends upon vehicle speed load, wheel and rail roughness, and other factors. Some of these sources can be controlled locally by regulation, such as with speed limits. Some factors are outside local control.
Community noise regulations and noise ordinances are of two main types: qualitative and quantitative. Qualitative types of noise ordinances prohibit excessive noise during certain hours of the day or night and/or prohibit some noisy activities during certain hours and in certain defined noise zones. The difficulty with such ordinances is that they are vague in nature and difficult to enforce. Quantitative noise ordinances, however, restrict noise generated and/or received. The levels allowed at the boundary where they are produced or the boundary where they are received are normally given as A‐weighted sound pressure levels. These quantitative ordinances need trained staff for enforcement who can use calibrated measurement instruments to determine the sound pressure levels accurately. Since noise levels fluctuate in the community and vary during day, evening, and night periods, average levels are often used such as the equivalent sound pressure level. The A‐weighted equivalent sound pressure level came into use in the United States in the 1970s, and recommendations have been published by the World Health Organization (WHO) for day and nighttime to protect people from becoming moderately or seriously annoyed. In the United States the day–night average sound pressure level is also widely used. In Europe the day–evening–night level is now increasingly used.
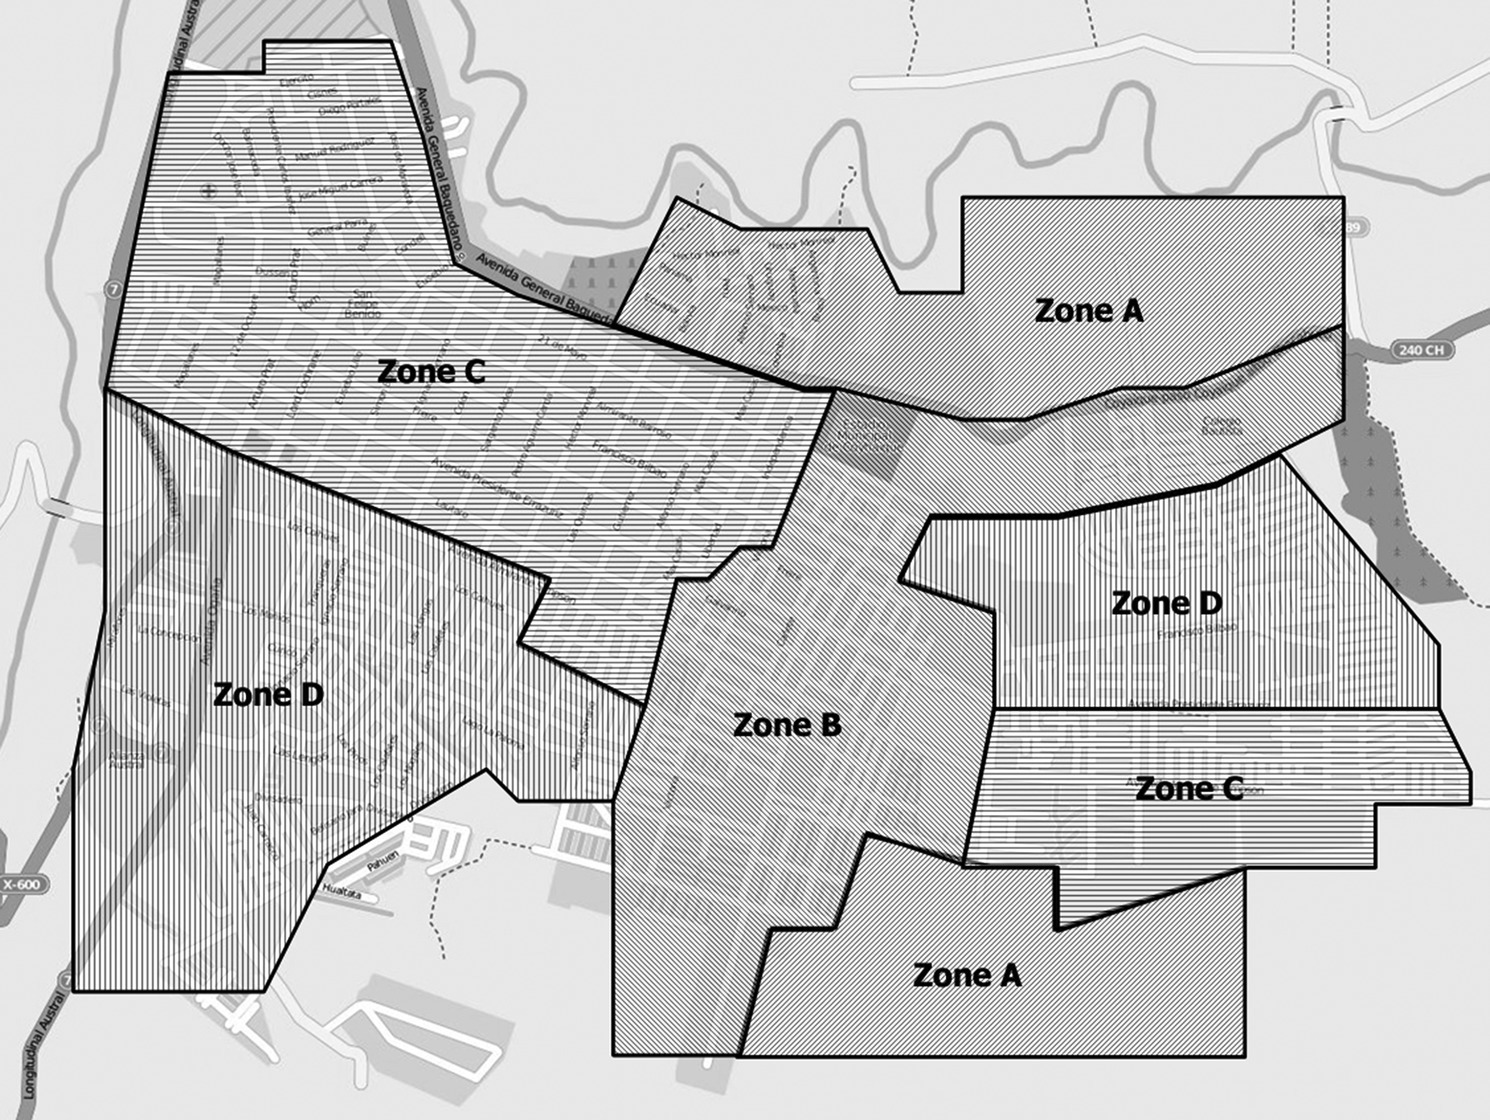
Some noise ordinances specify different noise zones that are defined for the activities performed in the zones. Figure 16.9 shows an example of such ordinance. Zones can be specified for heavy industry, light industry, residential, school, hospital, and other uses. Normally different noise zones are created with steps of 5 dB from noisiest to quietest zone with restrictions on the maximum noise permitted in each zone. For instance, some activities such as construction may be prohibited in some zones. Obviously, enforcement is essential if the ordinance is to have any use at all. Fines and other financial penalties can be used for enforcement. In the United States, the EPA Office of Noise Abatement and Control set limits for noise output of some sources such as heavy trucks and compressors on building sites and was active in producing a model community noise ordinance standard. Since 1980 centralized planning by the EPA Office of Noise Abatement and Control has largely been disbanded and taken up by different government agencies and local, citywide, or state authorities. In Europe a different situation exists. European directives in recent years have required strategic noise maps to be created for major transportation facilities such as airports and railway stations and for large cities. Action plans are required to manage noise problems and recommend noise reduction if necessary. The goal is to harmonize noise criteria and noise zoning and limits among the different European member states. The experience in other countries such as Australia, Canada, China, and Japan is described in detail in Ref. [2]. Further work and discussion on community noise evaluation and ordinances and regulations continues [72–80].
EXAMPLE 16.2
Consider that a quantitative noise ordinance restricts the noise generated at the city plan of Figure 16.9 according to Table 16.2.
The day time is defined as from 7 a.m. until 10 p.m. and night time as from 10 p.m. to 7 a.m. An industry located in zone A increases its capacity by adding more machines to a production line. The energy‐equivalent hourly A‐weighted sound pressure levels are measured at a point in zone A using an integrating sound level meter, and the results are presented in Table 16.3. Assess the community noise according to the city noise ordinance.
SOLUTION
The A‐weighted daytime average sound pressure level is calculated considering measurements 1–15 giving

The A‐weighted nighttime average sound pressure level is calculated considering measurements 16–24 resulting in

Therefore, the industry complies with the noise limit set for zone A by the noise ordinance during the daytime but it does not act in accordance during night time.
Table 16.2 Example of a community noise ordinance.
| Zone code | Description | Limits in A‐weighted Leq, dB | |
|---|---|---|---|
| Day time | Night time | ||
| A | Heavy industry | 75 | 70 |
| B | Commercial and light industry | 65 | 55 |
| C | Commercial | 60 | 50 |
| D | Residential | 55 | 45 |
Table 16.3 Data used in Example 16.2.
| Number | Time | A‐weighted sound pressure level, dB |
|---|---|---|
| 1 | 07:00 | 72 |
| 2 | 08:00 | 70 |
| 3 | 09:00 | 69 |
| 4 | 10:00 | 71 |
| 5 | 11:00 | 73 |
| 6 | 12:00 | 70 |
| 7 | 13:00 | 76 |
| 8 | 14:00 | 77 |
| 9 | 15:00 | 75 |
| 10 | 16:00 | 73 |
| 11 | 17:00 | 71 |
| 12 | 18:00 | 72 |
| 13 | 19:00 | 80 |
| 14 | 20:00 | 73 |
| 15 | 21:00 | 71 |
| 16 | 22:00 | 72 |
| 17 | 23:00 | 75 |
| 18 | 00:00 | 75 |
| 19 | 01:00 | 72 |
| 20 | 02:00 | 73 |
| 21 | 03:00 | 78 |
| 22 | 04:00 | 79 |
| 23 | 05:00 | 72 |
| 24 | 06:00 | 70 |
16.6.2 Recommendations for Urban Projects
Modern urban legislation should consider all of the environmental impacts caused by new projects and how to limit the noise in the city, particularly in residential areas. For this, it is necessary to have on hand the regulations corresponding to each community that establish the types of areas (in terms of land‐use) and their corresponding maximum permissible limits. As a rule, proper general and specific plans should always bring together economic and industrial development with quality of life in cities [107]. A general plan contains a set of goals for the future growth and development of the city. Instead, the specific plan is essential to carry out the goals of the general plan. According to the experience in several cities the following proposals for consideration in urban projects should be considered:
- plan the city specifying a set of zones according to their use, which is also suitable for noise issues,
- locate all community noise sources (airports, industrial areas, railways, highways, etc.) far away from the indoor and outdoor sensitive areas (residences, schools, parks, hospitals, etc.),
- make preference for underground instead of surface modes of transportation, and take measures to ensure that the inhabitants use public rather than individual transportation,
- plan the location of traffic lanes (especially heavy road traffic) far from residences and take steps to ensure free traffic flow,
- eliminate uneven surface roads and use porous road pavement surfaces,
- use screening attenuation (sound barriers, buildings, berms, etc.) between noisy roads and residences,
- enforce that the noise levels produced during the construction of the public and private infrastructure are below the noise limits,
- develop regulations for noise control at the facades, and
- conduct public awareness campaigns on the effects of noise.
16.6.3 Strategic Noise Maps
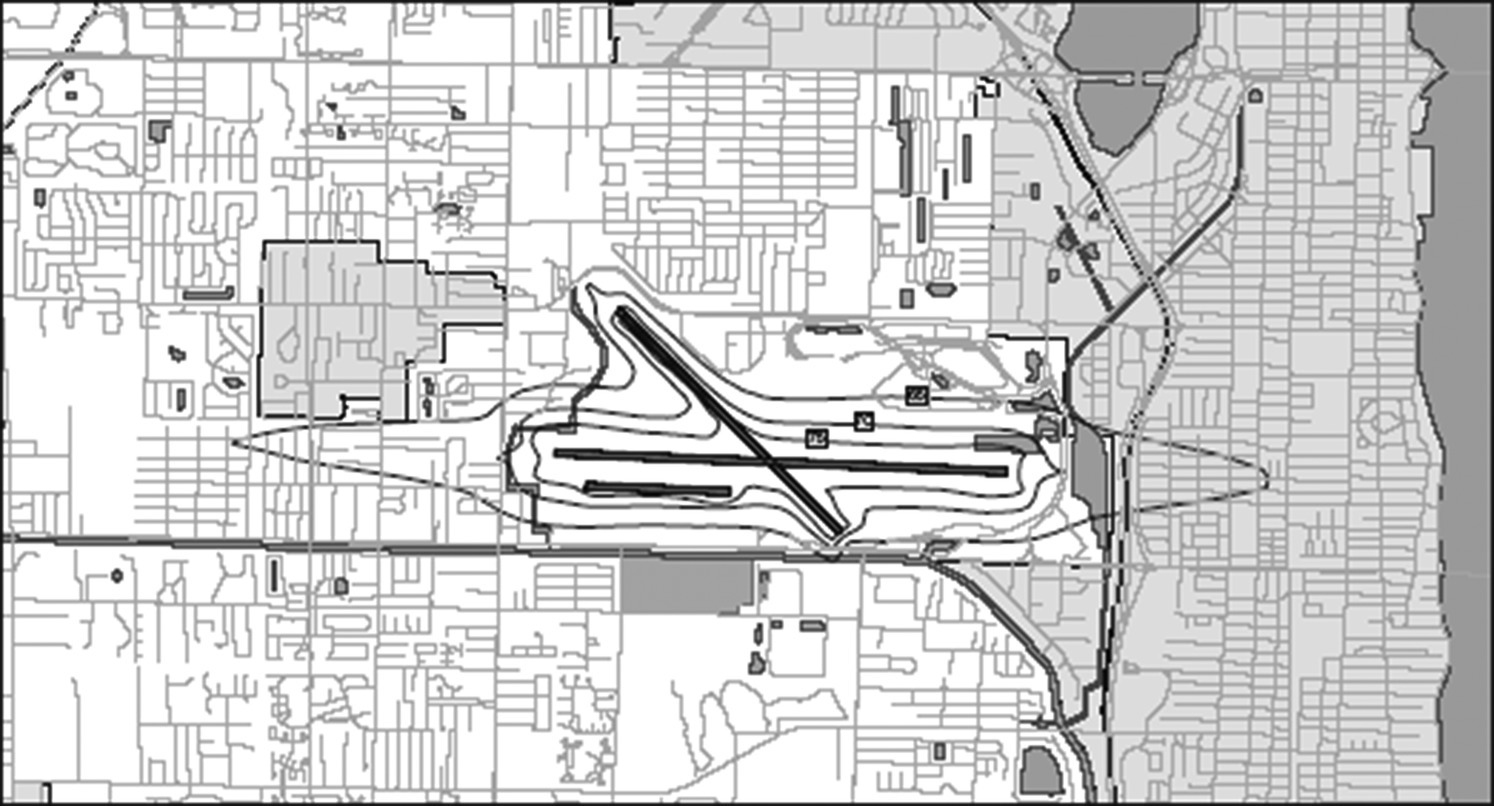
A noise map is a cartographic representation of the noise level distribution in a determined area and period of time. Strategic noise maps are important tools that can provide relevant information for local and global action plans. In urban administration and planning, noise mapping is a very useful tool for generating information about environmental impacts and enabling the visualization of noise pollution in the urban landscape. Many cities all over the world have produced noise maps for different modeling areas, several noise sources and with varied outcomes. Research on noise maps is a subject of great interest in European countries [108] where the use of geographic information systems (GIS) has provided relevant information for noise maps and specific maps have been developed for airport noise [109, 110]. Figure 16.10 presents a typical contour set of equal noise levels near the runways of an airport [44]. Since 2002, European cities are required to have a strategic noise map to meet the Environmental Noise Directives and Regulations [111, 112]. In this scenario, noise maps are tools that have several potential applications to help with: identifying noise levels within cities, identifying areas with greater exposure, and assessing future scenarios. They also serve as a basis for adopting actions to reduce noise levels through structural and nonstructural measures such as use of urban planning tools [113]. In addition, noise maps are an important tool for environmental education and awareness.
Currently, computer‐based calculation methods have become adopted into general practice in the creation of noise maps. Regardless of their advantages and shortcomings with respect to sampling methods based on in‐situ measurements, maps are still needed to verify the results obtained [112]. The computer software needs information on cartographic data and noise sources, among other inputs to perform the modeling process. Of course, the cost of producing a noise map for a large city could become very high and recent studies have been aimed to produce cost‐effective noise maps through use of simplified methodologies [114, 115].
During the period 2009–2012 the European Commission developed CNOSSOS‐EU (Common Noise Assessment Methods in Europe), the common and harmonized methodological framework for strategic noise mapping under the European Directive 2002/49/EC for the assessment and management of environmental noise [111, 116]. The main goal was to have the common noise assessment methodology operational in 2017. However, due to a number of challenging issues that had taken too long to overcome [116, 117] CNOSSOS‐EU will probably only be implemented and operational for a future round of strategic noise mapping.
16.6.4 Soundscapes
For the last 30 years, the concept of soundscapes has been studied in a multi-disciplinary approach and nowadays is an important issue to consider in environmental acoustics. The term soundscape was coined by Schafer [118] as the study of the effects of the acoustical environment on the physical responses or behavioral characteristics of creatures living within it. More recently, in 2014 the ISO standardized the definitions of an acoustical environment as the sound at the receiver from all sound sources as modified by the environment. The same standard defines a soundscape as the acoustical environment as perceived or experienced and/or understood by a person or people [119].
Therefore, a soundscape is composed of the natural acoustical environment (animal vocalizations, weather, natural elements) and environmental sounds created by humans (music, ordinary human activities, and sounds originated from industry). Thus, a person may consider noise pollution to consist of any disruption of their acoustical environment.
It is well known that acoustical environments may have negative or positive effects on human health and wellbeing. Quiet areas, such as natural environments make a positive contribution to public health since they enhance physiological recovery from stress, induce positive emotions and reduce mental exhaustion. People relate to their acoustical environments on an emotional level by interpreting the sensory information they receive. Thus, soundscape characteristics define a particular environment as a desirable or undesirable place to occupy, as uniquely judged by each individual [120]. Environments having acoustical stressors (i.e. noise) tend to induce negative emotions, and motivate an avoidance response, while environments free from such stressors (i.e. parks, green spaces, and natural or wilderness areas) may induce positive emotions and motivate an acceptable response [120]. In addition, certain acoustical environments can be linked by people to particular events in their lives and eventually they like to keep these memories by preserving the associated sounds, even though these sounds can induce negative emotions in others.
Listening is one of the psychological functions through which people perceive the world. Evaluating the effects of sounds on people is primarily a subjective issue rather than one merely based on objective parameters [121]. To explore people’s perceptions of a soundscape, the comprehension between the acoustical stimulus and opinions of inhabitants has been investigated qualitatively by means of the grounded theory approach [122].
Therefore, identification of all the factors related to the psychological needs of the urban soundscape is extremely important in creating a comfortable acoustical environment and to help in identifying the existing urban areas and exploring the developmental trend of soundscapes [123]. Many other studies on soundscapes in both urban and rural environments exist and further research on the subject continues
Leave a Reply