10.9.1 Finite Element Analysis
Young and Crocker [44–48] were the first to use finite element analysis in muffler design. So far in this chapter it has been assumed that the mufflers are axi‐symmetric in shape and acoustic filter theory [21, 22] provides a sufficient theoretical explanation for the behavior of muffler elements. This filter theory is normally based on the plane wave assumption. However, when a certain frequency limit is reached (known as the cutoff frequency), the filter ceases to behave according to plane wave theory. (This cutoff frequency is usually proportional to the pipe or chamber diameter.) In addition, if the muffler element shape is complicated, the simple plane wave assumptions and the boundary conditions are difficult to apply.
In Young and Crocker’s work, first provided to a sponsor in 1971 [44], a numerical method was produced to predict the TL of complicated‐shaped muffler elements. In this approach, variational methods were used to formulate the problem instead of using the wave equation. The theoretical approach is described in detail in [44–48] and will not be given here. It is assumed that the muffler element is composed of a volume V of perfect gas with a surface area S. The surface S is composed of two parts: one area over which the normal acoustic displacement is prescribed and the other area over which the pressure is prescribed. The pressure field in the muffler element is solved by making the Langrangian function stationary [44–46]. Thus, this approach is essentially an approximate energy approach. The muffler element is divided into a number of subregions (finite elements). At the corners of the elements the acoustic pressure and volume velocity are determined. The four‐pole parameters A, B, C, and D, relating the pressure and volume velocity before and after the muffler element, are obtained in a similar manner to that described above assuming that the matrix output terminals are alternately open‐circuited or short‐circuited [44–46].
At the corners of the elements the sound pressure and volume velocity are determined. The four‐pole parameters A, B, C, D, relating the pressure and volume velocity before and after the muffler element are obtained in a similar manner to that described above assuming that the matrix output terminals are alternately open‐circuited or short‐circuited [44–46].
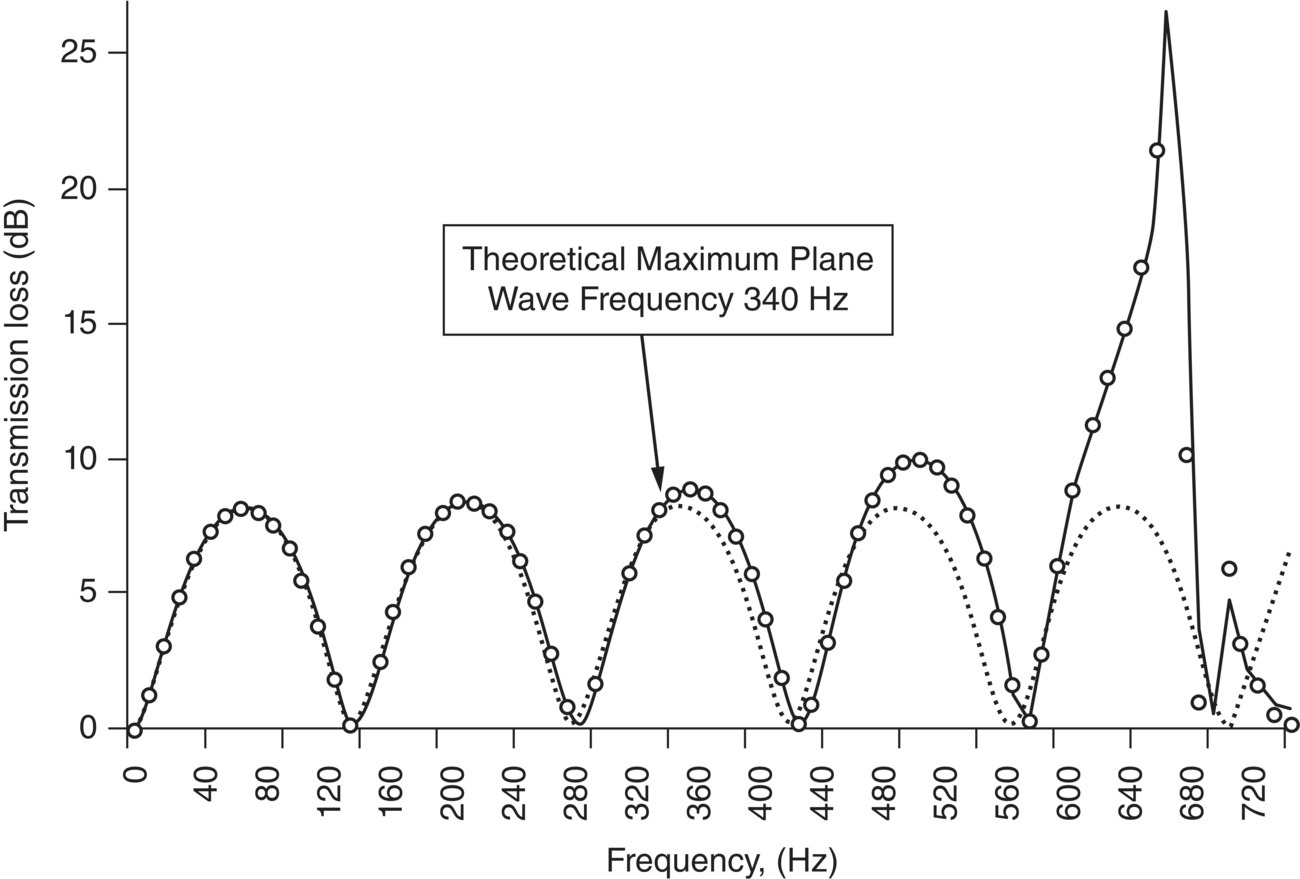
In order to check the finite element approach and computer program, it was first applied to the classical expansion chamber case. See Figure 10.29. The dimensions of the simple expansion chamber used are given in Figure 10.29. The chamber was 8 in. (0.20 m) long and 10 in. (0.25 m) in diameter. Since the chamber was symmetrical, only half the chamber was represented with finite elements. Three finite element models were studied. The first had 8 elements with 16 nodal points, the second had 16 elements with 28 nodal points (see Figure 10.29). The third had 24 elements with 38 nodal points.
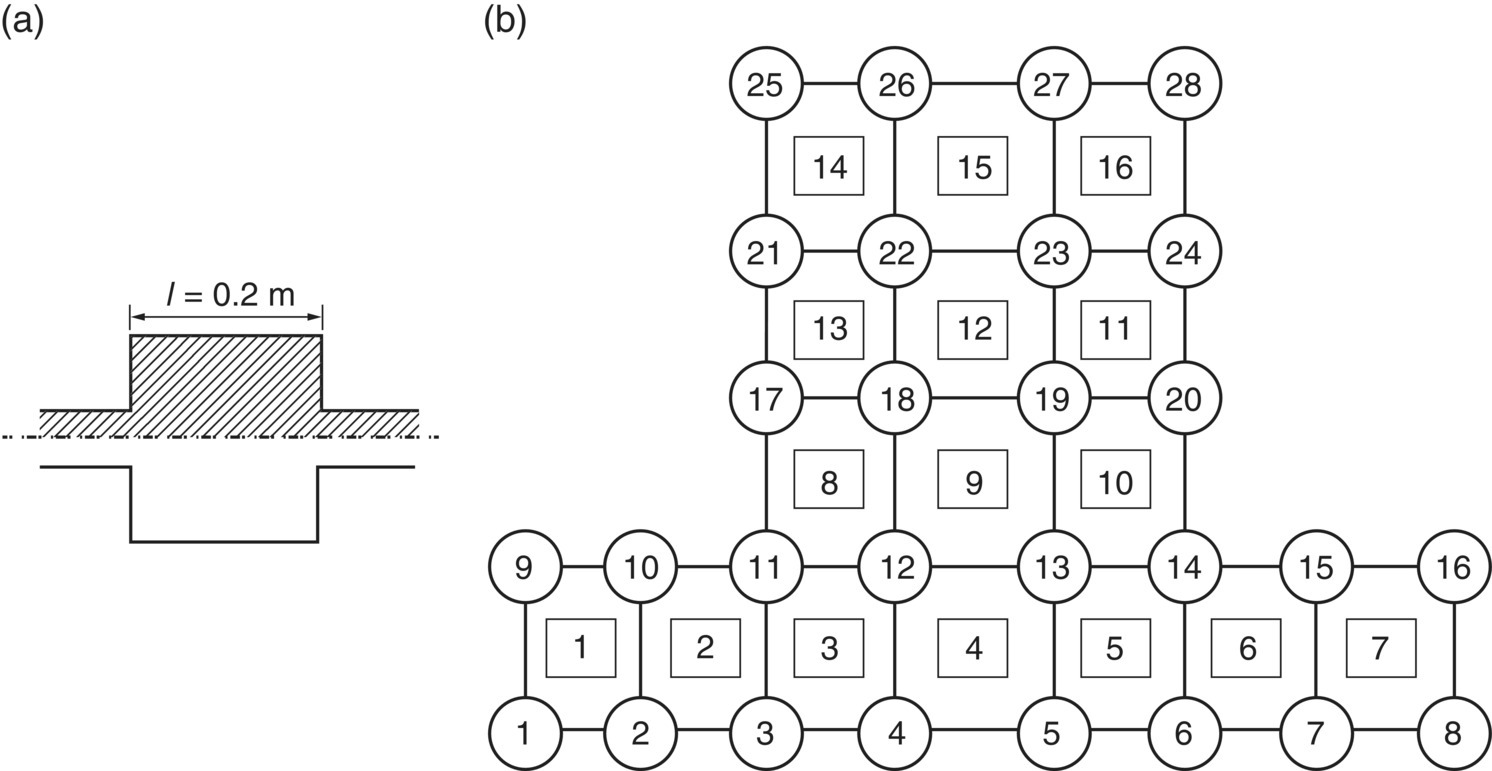
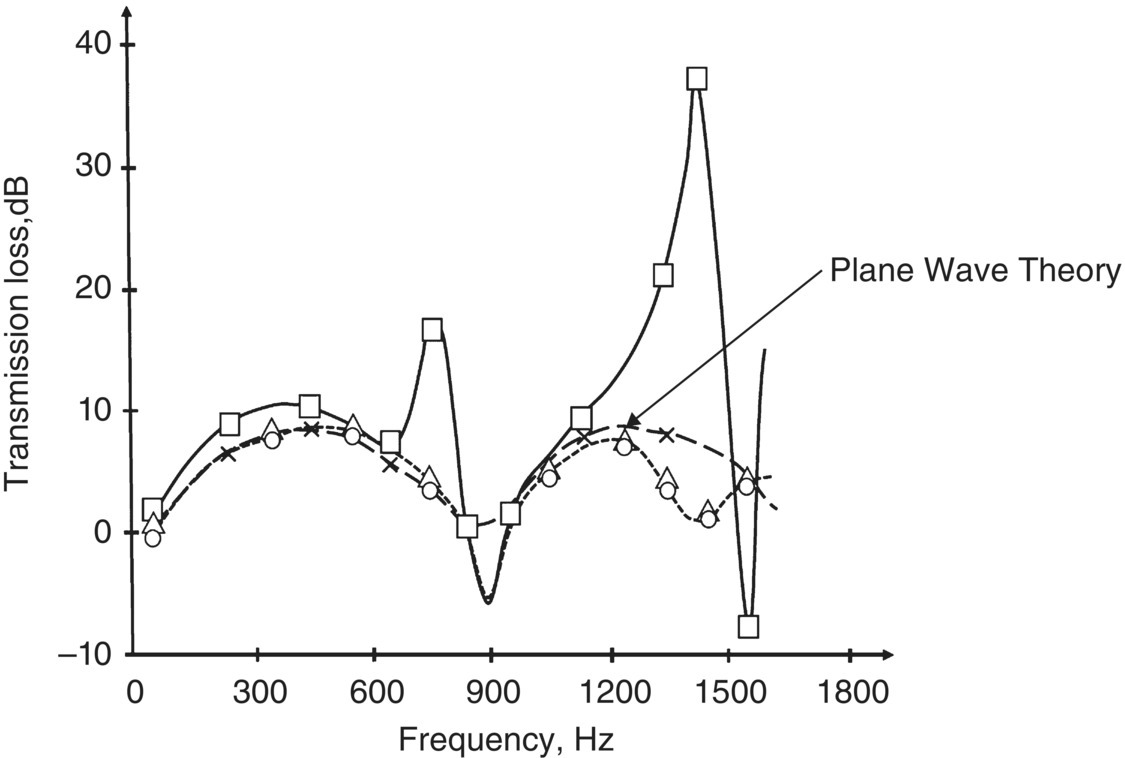
Figure 10.30 shows the TL predicted by the three finite element models and by the classical theory for an expansion chamber (see Eq. (10.12)). It shows the rapid convergence of the finite element approximation. Eight elements are insufficient to predict the TL, although the TL predicted by 16 or 24 elements is about the same. Note, however, that above about 1100 Hz, the classical theory and the finite element TL predictions diverge. Above this frequency the chamber‐diameter‐to‐wavelength‐ratio becomes less than 0.8 and higher modes are present in addition to plane waves, can exist in the expansion chamber. However, the classical theory (Eq. (10.12)) only predicts the plane wave performance.
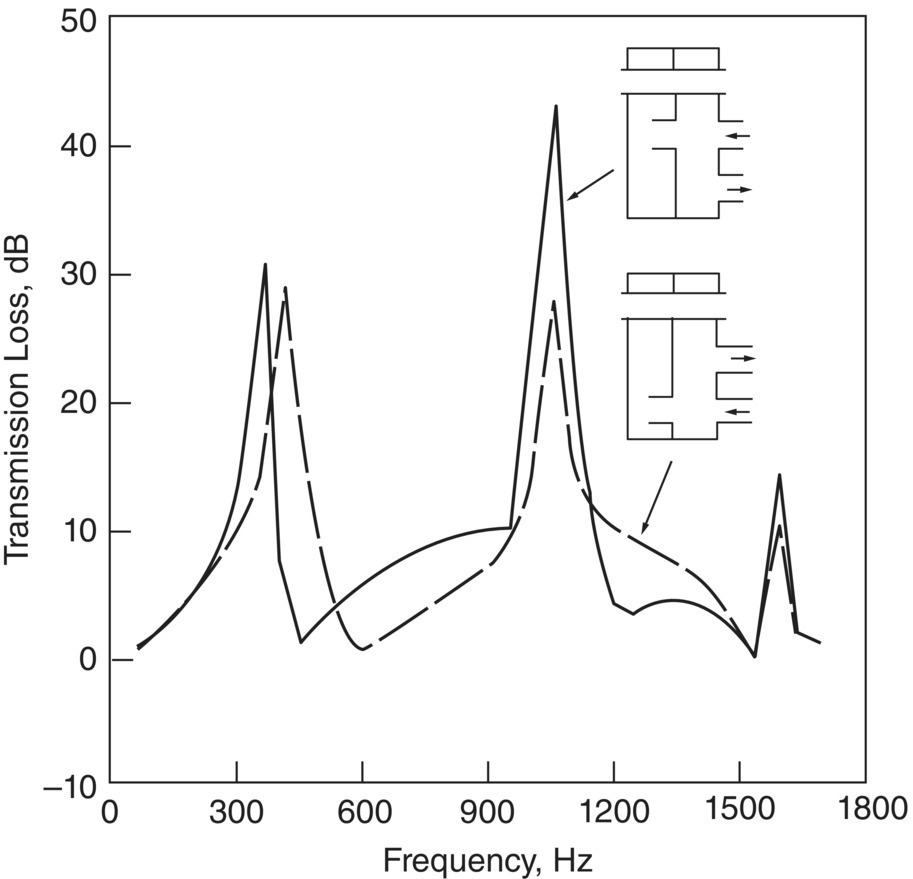
Having shown that the finite element program could be used to predict TL successfully on known chambers, it was now used to examine chambers such as reversing flow end chambers (see Figure 10.31). Then it was used with end‐chamber Helmholtz‐resonator combinations and finally mufflers comprised of combinations of straight pipes, end chambers and up to two Helmholtz resonators.
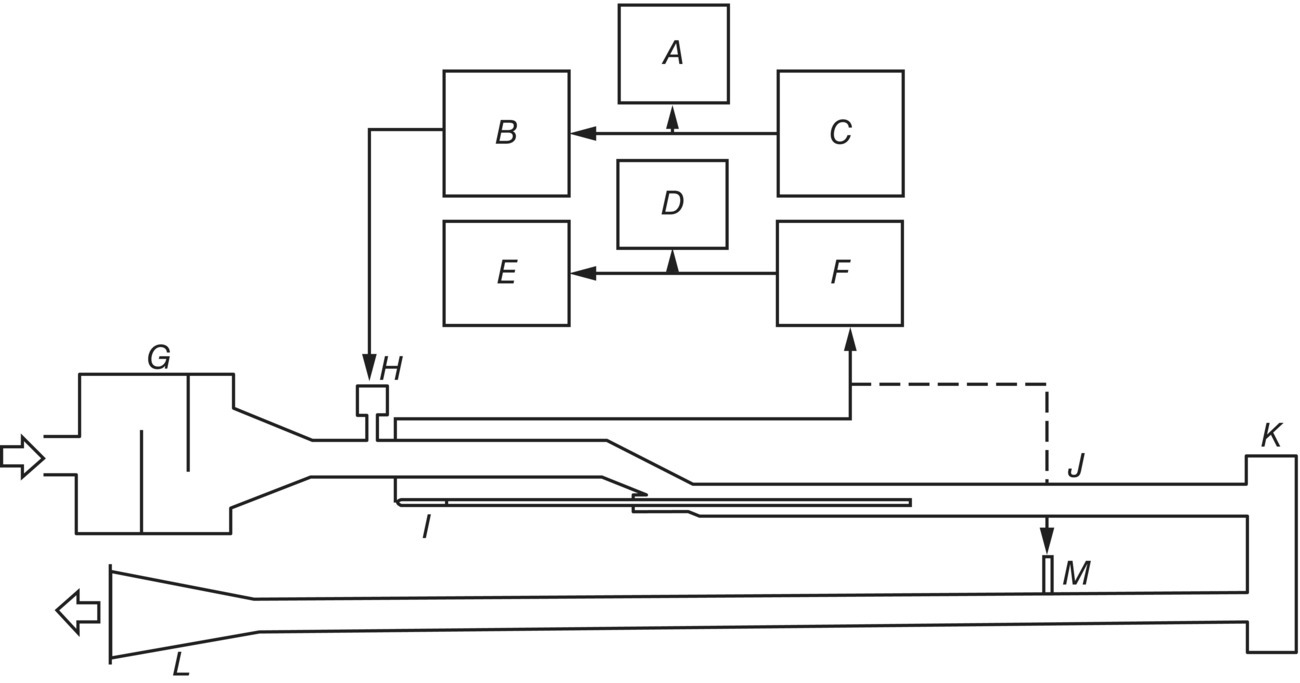
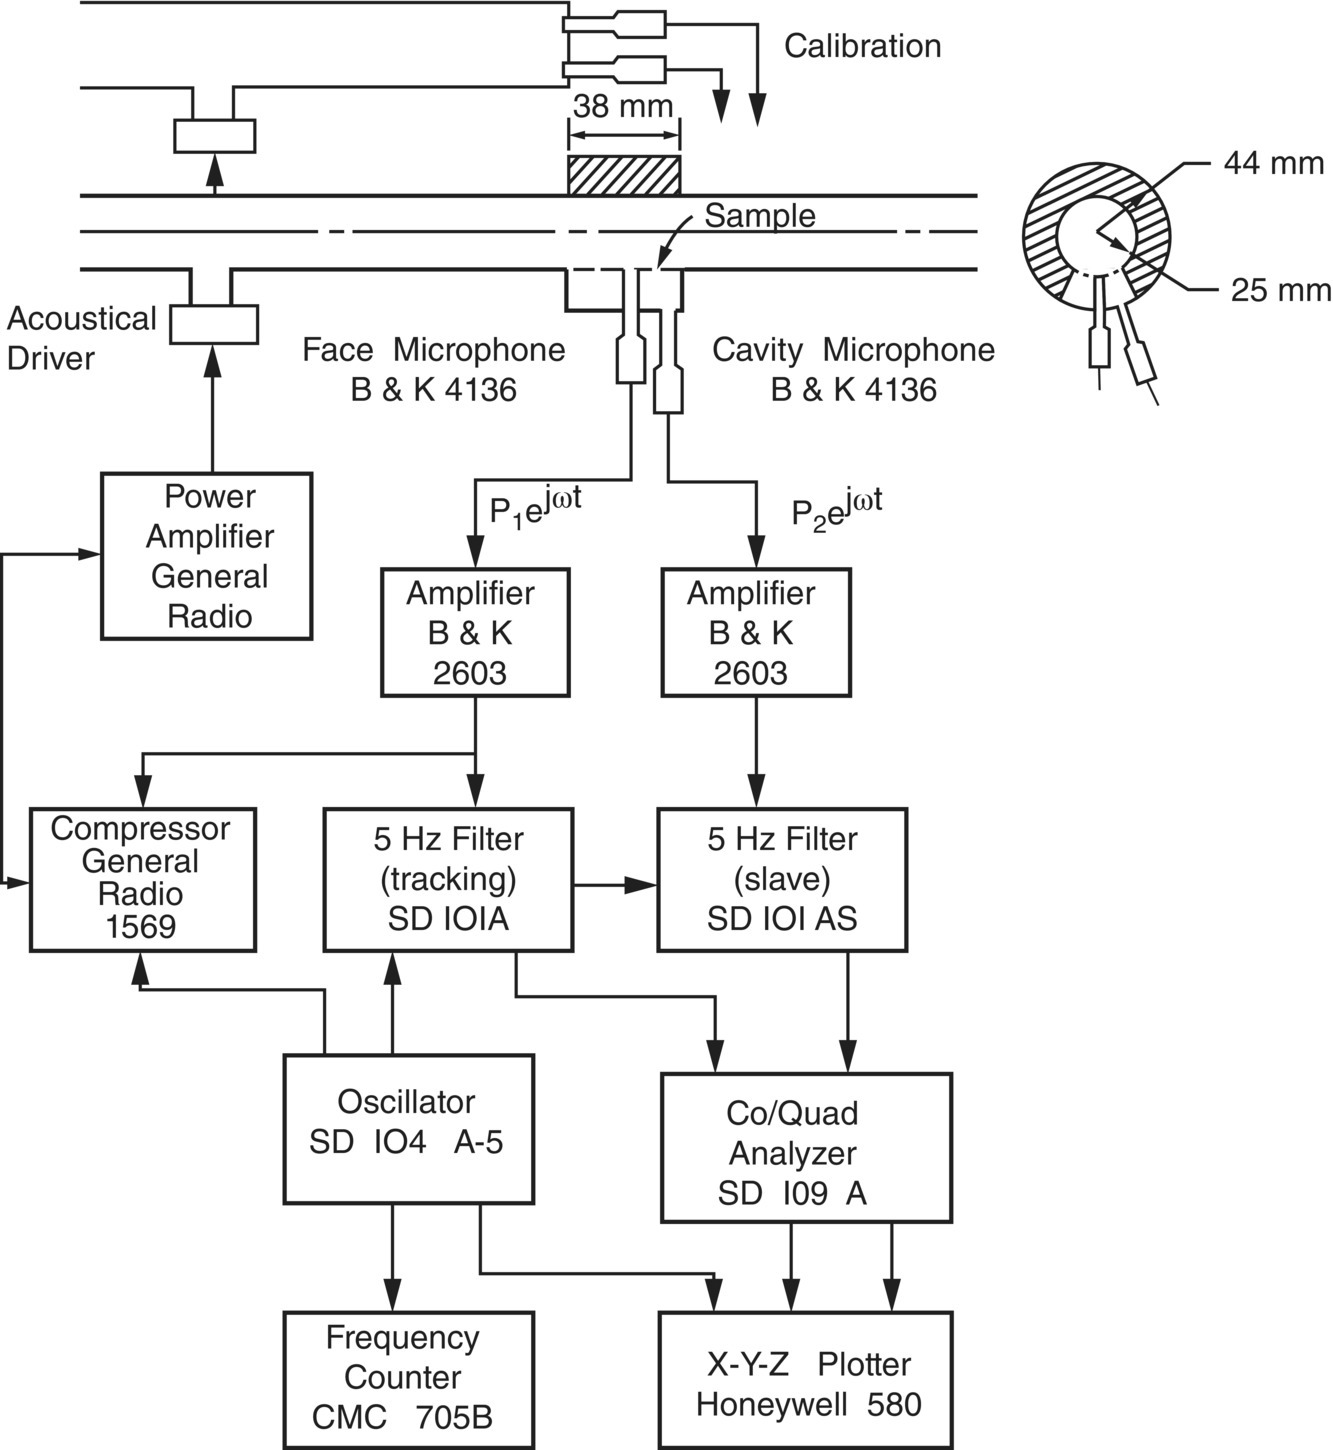
A typical end chamber examined is shown in Figure 10.31. The measurement of TL was based on the standing wave method, see Figure 10.32. An acoustical driver (H) was used to supply a pure tone signal and the standing wave in the test section (J) was measured with the microphone probe tube (I). Using standing wave theory, the amplitude of the incident wave was determined by measuring the maxima and minima of the standing wave at different frequencies. The transmitted wave was determined by a single microphone (M), since the reflections were minimized by the anechoic termination (L). A steady mean air flow could be supplied to the plenum chamber (G) and was used to investigate flow effects on TL in some experiments.
Figures 10.33 and 10.34 show the predicted and measured TL of two different shape reversing end chambers, with and without a mean air flow of 110 ft/s (33.5 m/s). Neither end chamber examined had a pass tube. The first chamber has side‐in side‐out (SI‐SO) tubes and the second side‐in center out (SI‐CO) tubes. It is observed that experimental agreement with theory is good and that flow effects appear small at the mean flow velocity (Mach number) used. Part of the volume appeared to act as a side‐branch with the SI‐CO chamber (Figure 10.34). The theory developed was then used to conduct a theoretical parametric study on reversing end chambers as dimensions, and locations of inlet, outlet and pass tubes were changed. The results are given in Ref. [47].
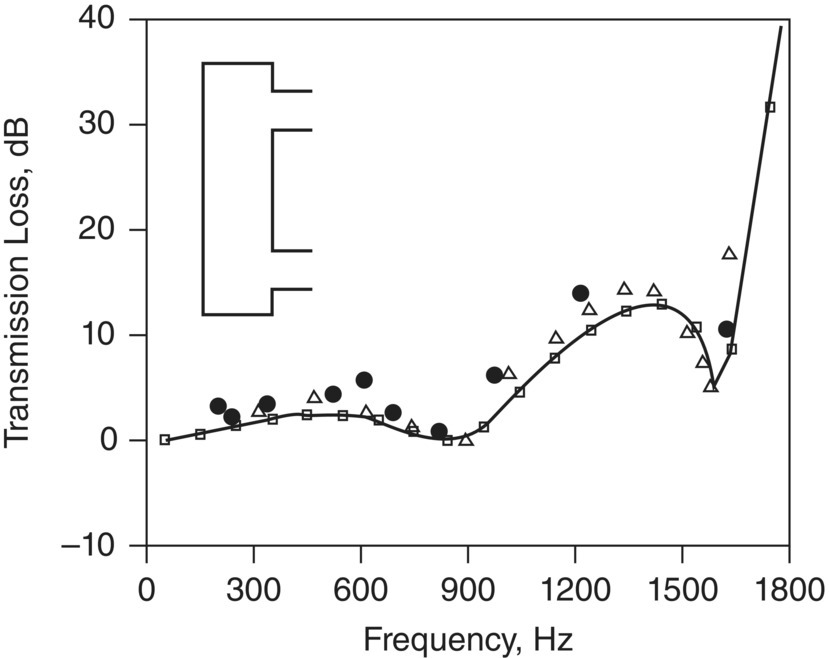
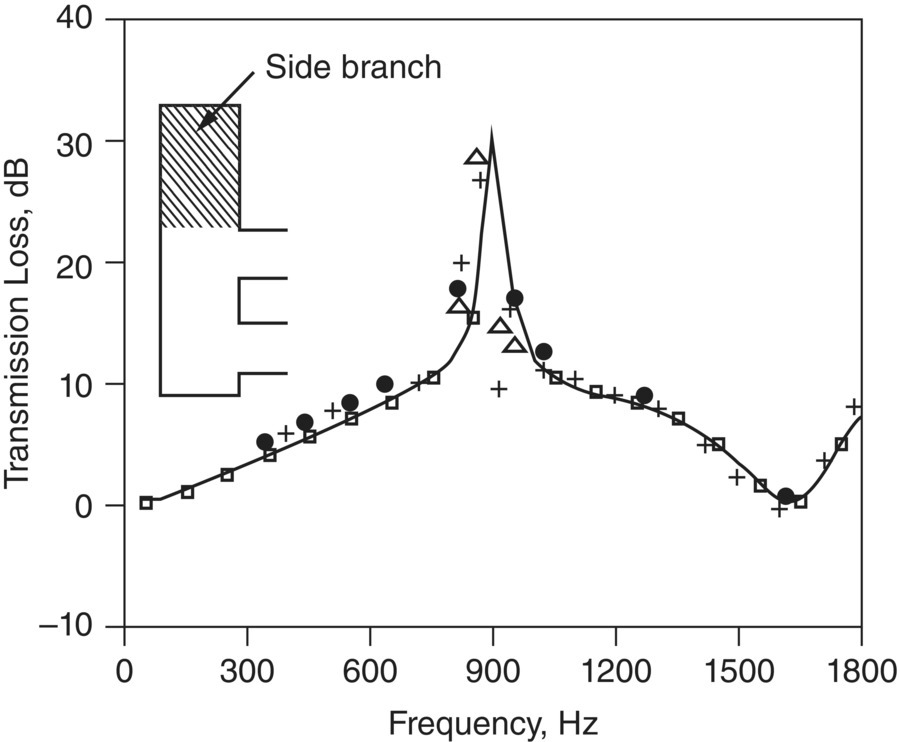
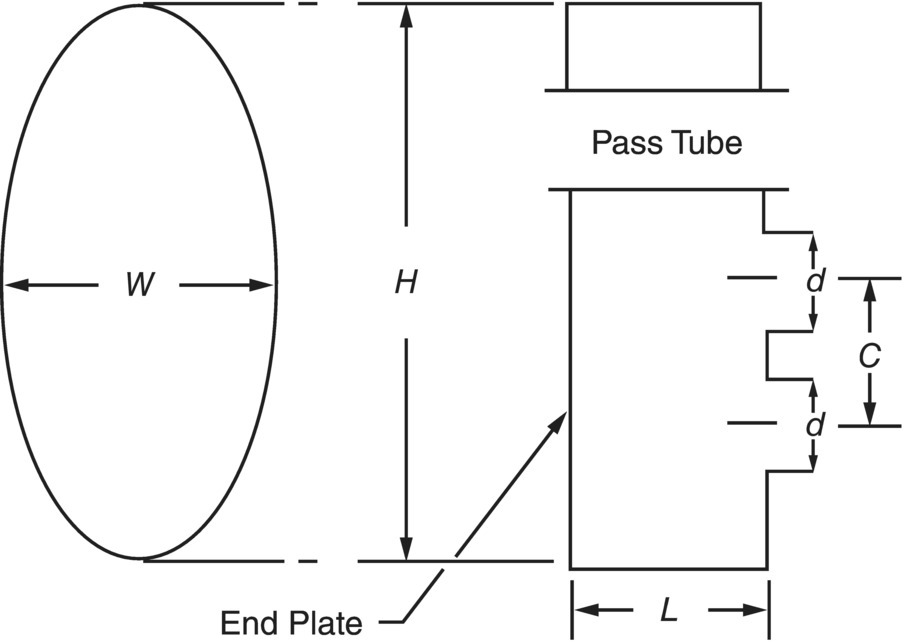
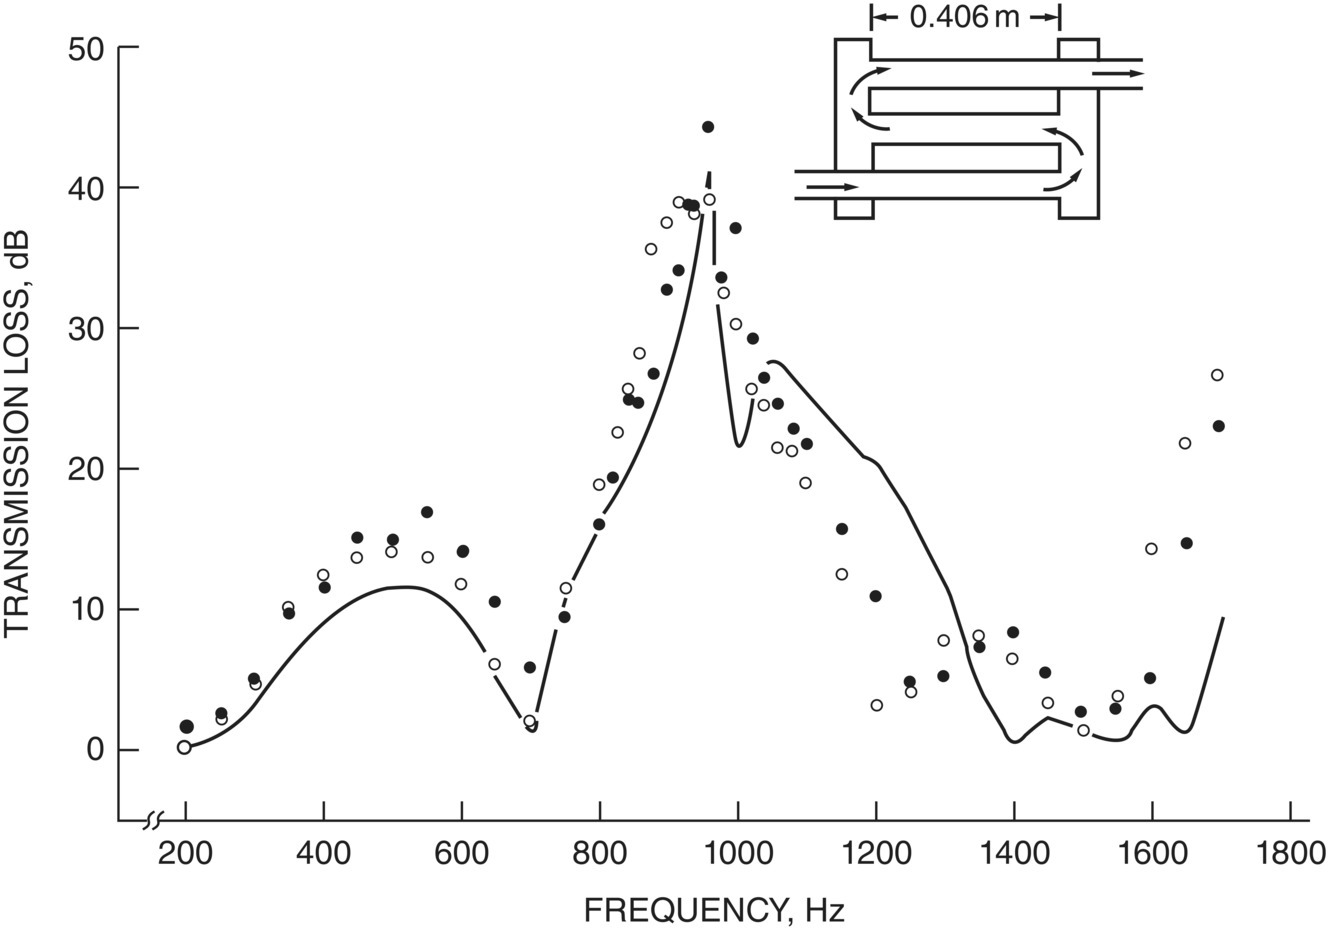
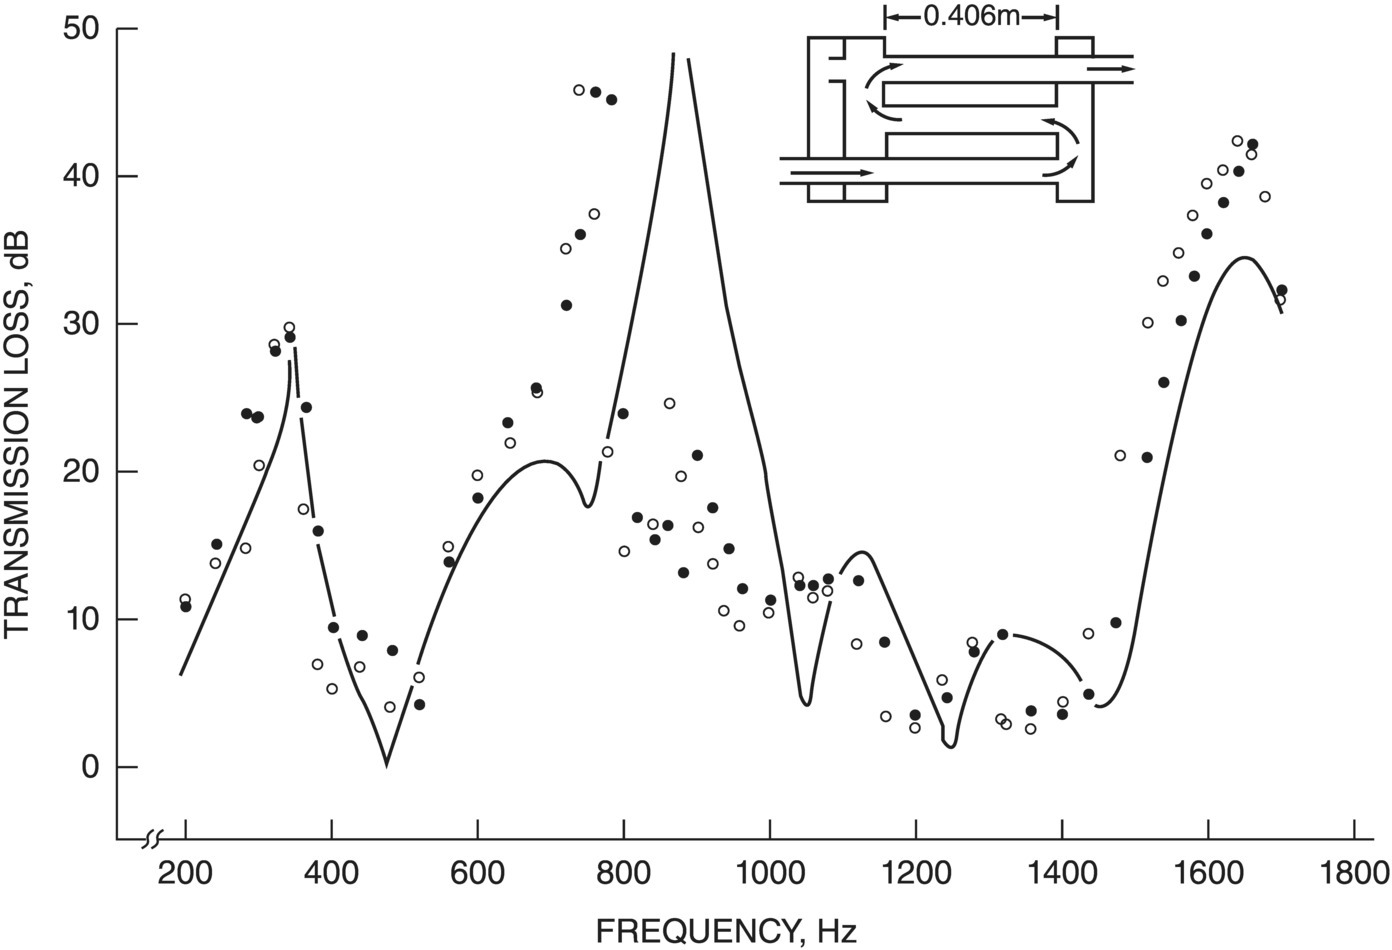
Figures 10.35 and 10.36 show the predicted and measured TL of similar SI‐SO and SI‐CO end chambers both of which have pass tubes. Both the cases when the end chambers have Helmholtz resonators attached (solid line) and when there are no resonators (broken line) are shown. The no‐resonator cases are similar to Figures 10.33 and 10.34, except that here pass tubes are present. It should be noted that the experimental points were measured without flow but with resonators attached. The predictions were made by dividing both the end chamber and the resonator into finite elements [47]. Although only two‐dimensional finite elements were used, the third dimension and the elliptical cross‐sectional shape were allowed for by varying the mass of the elements corresponding to their thickness [44–48]. It is noted in Figures 10.35 and 10.36 that the addition of the Helmholtz resonators produces sharp attenuation peaks in the TL curves. The first resonance frequency peak at 350 Hz agrees well with the value of 356 Hz calculated for the resonance frequency of a Helmholtz resonator using lumped parameter (mass‐spring) theory. The higher frequency peak must be produced by a higher mode resonance caused by interactions between the Helmholtz resonators and the end chambers.
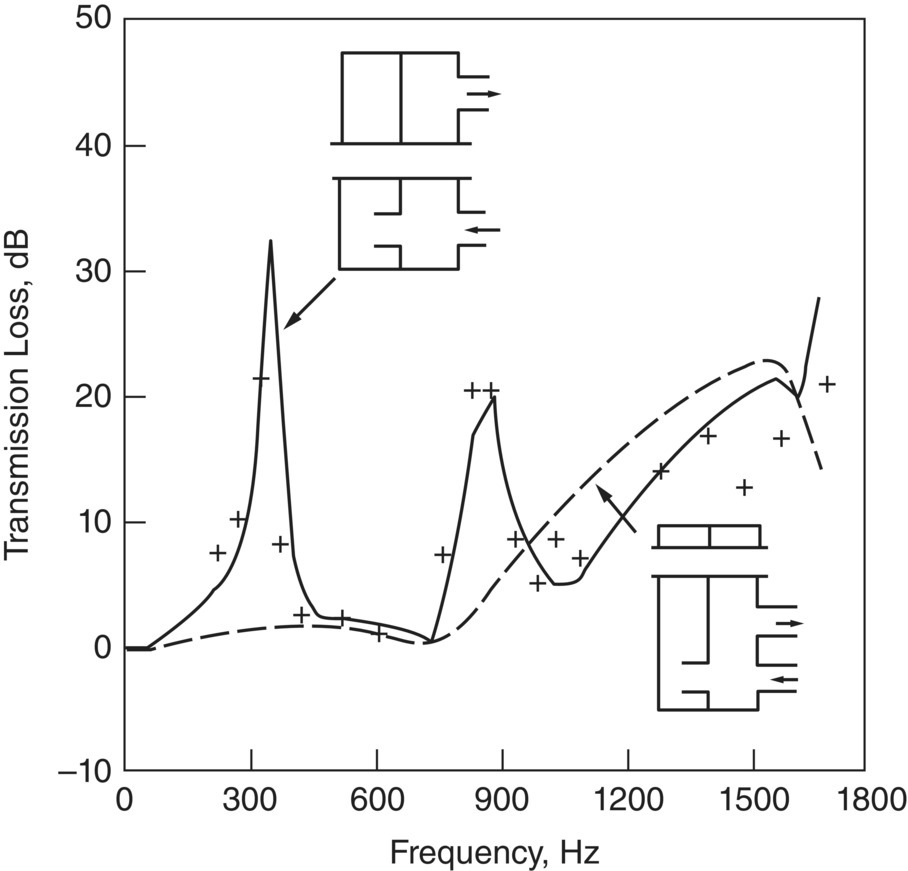
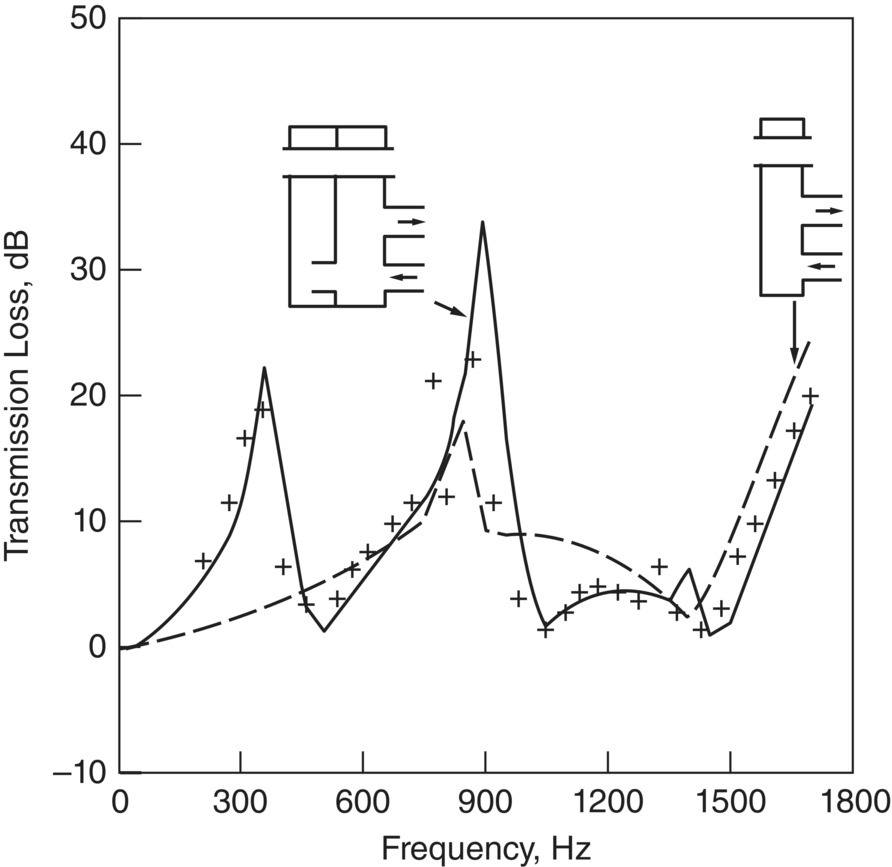
Figure 10.37 shows that the positioning of the resonator neck is theoretically an important factor in determining the TL curve [48].
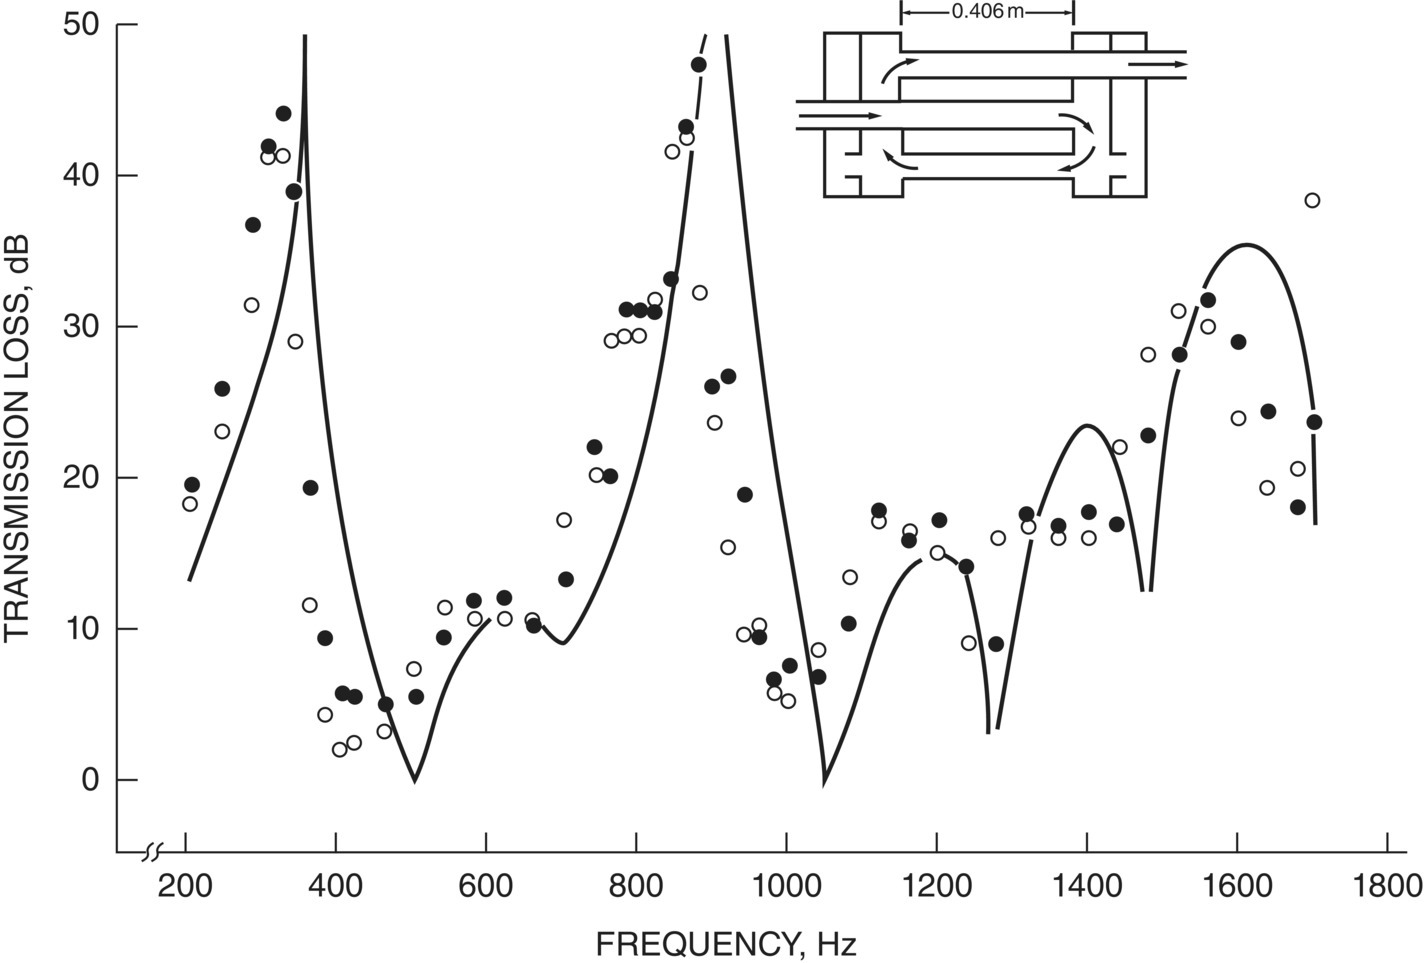
Figures show the predicted and measured TL for three different muffler combinations. The predictions were made by combining the predicted four‐pole parameters of the end‐chamber systems with those of the straight pipes using the matrix multiplication method discussed earlier (see Eq. (10.46)). The muffler combinations shown in Figures 10.38–10.40 are typical of automobile reverse‐flow mufflers used in the USA except that cross‐flow elements and side‐branch concentric resonators are absent. It is seen that, at least at the low Mach number used (flow velocity of 32 m/s), that there is very little difference in the TL measured with or without flow. Flow effects may be more important at higher flow rates (corresponding to higher engine loads). Also, flow is expected to have a greater effect on the radiated sound (see Eq. (10.1) and Figure 10.5).
The finite elements (FEM) approach continues to be used to analyze the acoustical performance of mufflers. An important development is the availability of in‐house and commercial FEM (and boundary element method [BEM]) software programs and computer codes. The BEM is discussed in the next Section 10.9.2. The first FEM code developed for muffler design was produced in‐house on punched computer cards for a large digital computer at Purdue University in 1970 by Young and Crocker [44, 45]. The development of this in‐house code continued until the end of the 1970s under several contracts for Arvin Industries [74].
Interestingly, the first commercial software contained both FEM and BEM softwares and was produced by SYSNOISE (now called SIMCENTER) in 1988. A number of other such codes are now available such as, ABAQUS, ACTRAN, ANSOL, ANSYS, COMET, COMSOL, LS‐DYNA, MUMPS, VA‐One, and VNOISE [75–81]. The well‐known FEM code, NASTRAN, was originally created for structural analysis, but now marketed by MSC, it can also be used for acoustical problems.
Although, the FEM and BEM numerical methods are now well developed, muffler manufacturers still rely to a large extent on modifying existing muffler designs and testing them to obtain the acoustical performance desired. Bilawchuk and Fryfe discuss the use of FEM and BEM to predict the TL and IL of mufflers at the design stage [75]. They also describe the so‐called “traditional” laboratory method the four‐pole transfer matrix method and the three‐point method used in the calculation of TL. They conclude that the FEM is better suited than the BEM in the TL determination of mufflers. The BEM is, however, superior in determining the IL since it does not have the problem of the infinite medium domain at the exhaust tube outlet. In addition, they state that the three‐point method is faster and easier to use than the four‐pole method [75]. Figure 10.41 shows the results obtained with the traditional method for both FEM and BEM [75].
Zhou and Copiello have used FEM modeling coupled with the transfer matrix approach (TMM) to examine complicated muffler systems [76]. In the motorcycle systems they have analyzed, both pipe transmitted noise and muffler shell radiated noise are of concern. In such cases, the acoustical FEM can be easily coupled to the structural FEM. FEM modeling appears to have an advantage over BEM, since mean flow and temperature gradient effects are easier to incorporate. In their studies they have used both ACTRAN and MUMPS.
Using the acoustics module of the COMSOL Multiphysics software, Vasile and Gillich have predicted the TL of an expansion chamber with and without a 15 mm layer of glass wool sound‐absorbing material [81]. Figure 10.42 shows the TL without glass wool and with 15 mm glass wool. It is seen that the addition of a 15 mm glass wool layer smooths the TL behavior and increases the TL particularly in the high frequency range. However, sound‐absorbing materials cannot always be used since they can absorb moisture, oil, and particles, which can severely degrade their performance.
10.9.2 Boundary Element Analysis
The BEM can be used for interior, exterior, and multidomain problems. It was developed subsequently to the FEM approach during the late 1980s by Seybert and his colleagues [82]. Its application to interior domain muffler analysis will be reviewed here. BEM and FEM share a number of assumptions and features, in particular the use of element division of the domain and pre‐ and post‐processing of the information generated [82]. An advantage of the BEM is that the boundary surface needs to be modeled with mesh elements. Another advantage is that for infinite domain problems (such as the sound radiation from a muffler tailpipe), the so‐called Sommerfield radiation condition. The advent of the AML capabilities has helped to overcome this infinite domain problem. Thus, there is no need to create a mesh to approximate the radiation condition.
Figure 10.43 shows the boundary element mesh created for a simple expansion chamber muffler. A series of points (called nodes) are selected on the interior muffler surface which are connected together to form the elements. The elements can be either of quadrilateral or triangular shape. The elements must be chosen to be small enough to produce an accurate solution, but not so small than an excessive amount of computer time is required. Figure 10.44 shows the TL made with experiment.
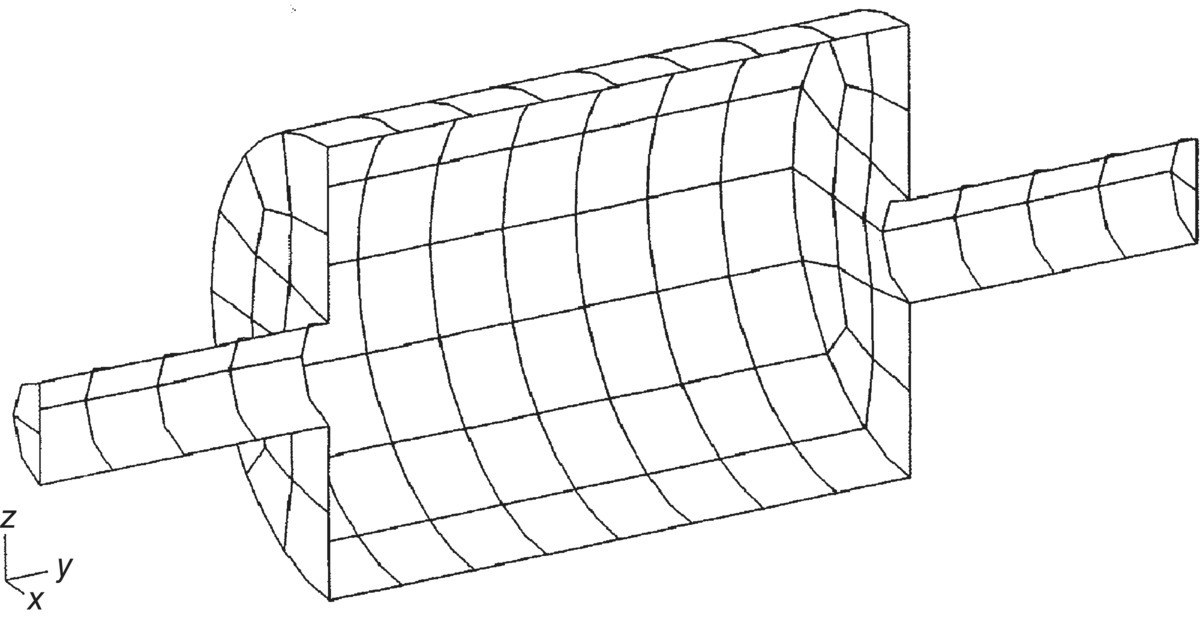
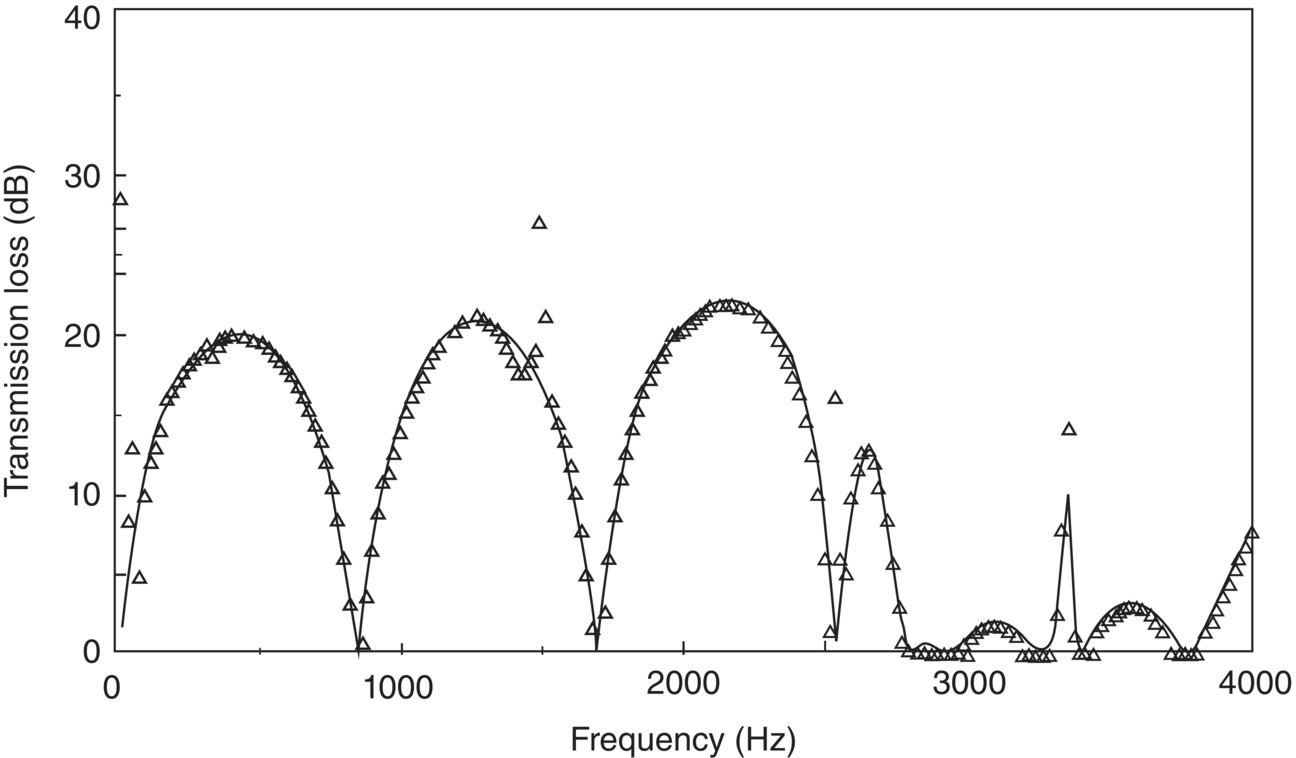
Figure 10.45 shows the SPL contour plot at 2900 Hz for this muffler. This frequency is seen in Figure 10.44 to be where the TL is almost zero and where a cross mode is excited making the muffler performance very poor. The SPL variation from 65 dB to 95 dB is shown and the variation of SPL in the radial direction is clearly seen.
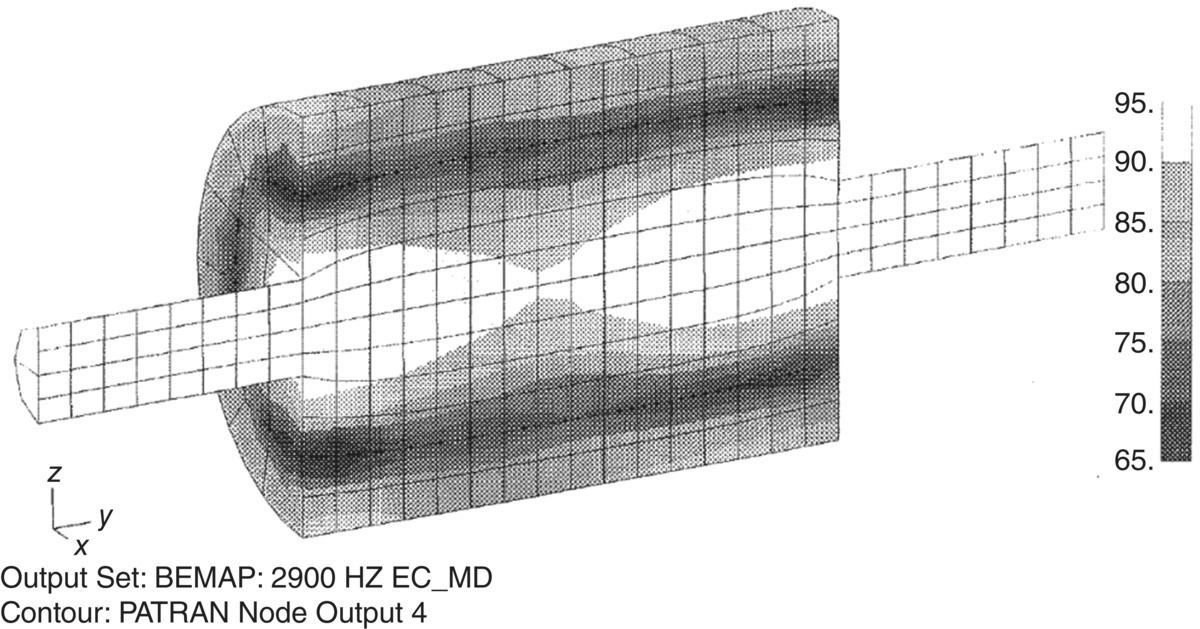
Figure 10.46 shows a muffler in which a multidomain model is used. The BEM allows for temperature variation. The first volume is filled with bulk‐reacting absorbing material housed under a perforated inlet tube. The BEM modeling also allows for inclusion of the perforations.
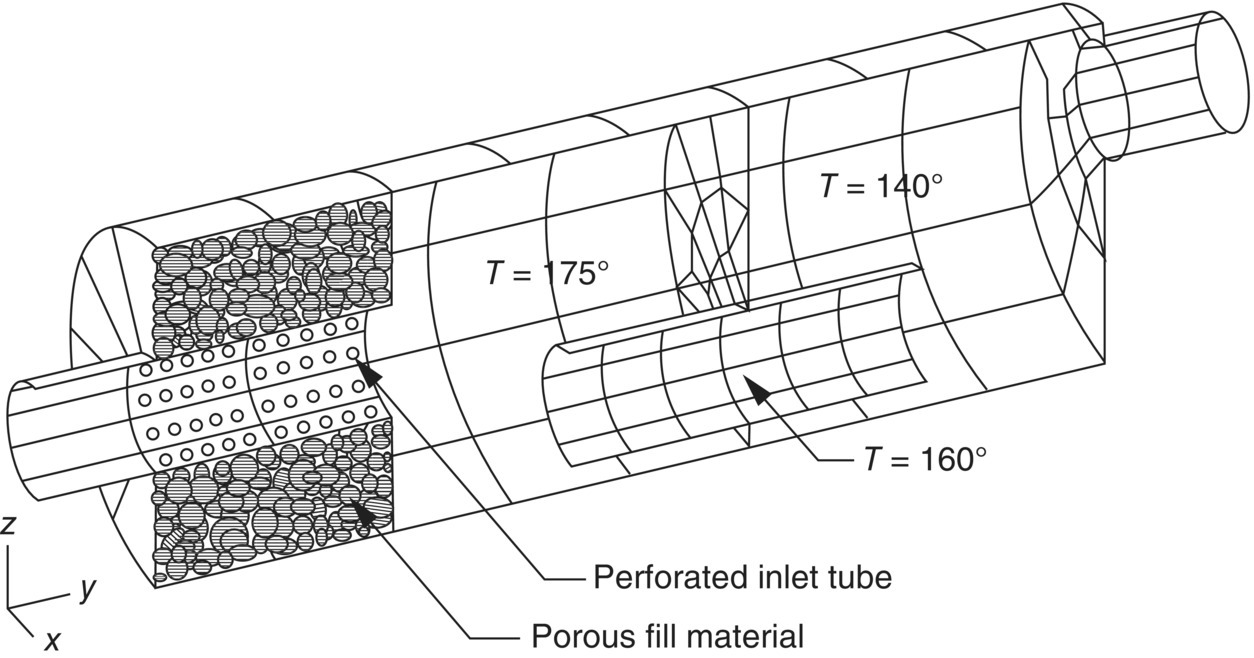
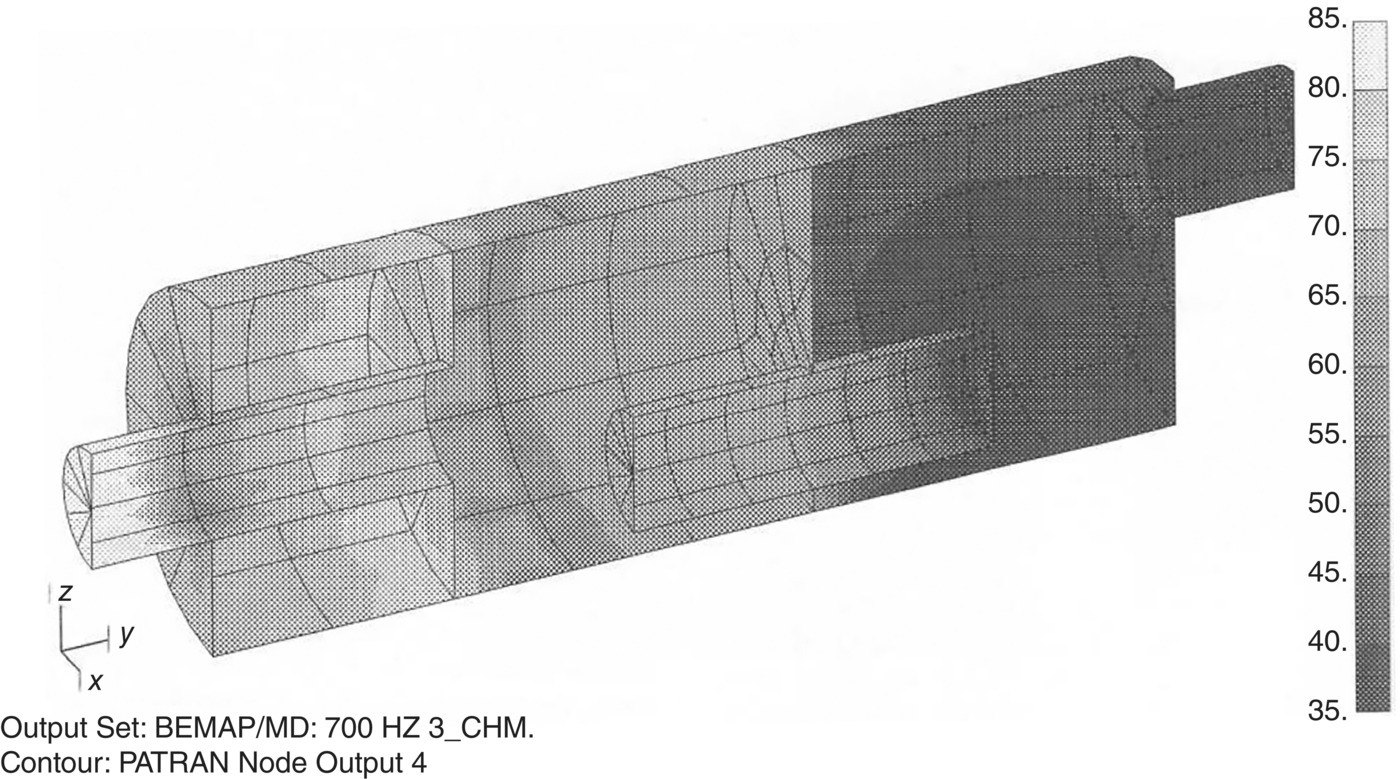
Figure 10.47 shows the SPL contour plot for this muffler at 700 Hz. The SPL varies from 85 to 35 dB. The reduction in the SPL from the inlet to the outlet of the muffler is clearly seen [83].
Seybert and Cheng published a study in 1987 concerning the use of the BEM for the solution of interior acoustics problems [82]. As they state, the BEM approach is ideally suited for use in the TL predictions. They found that predictions they made using the BEM are in excellent agreement with those using the FEM. Figure 10.48 presents their results for the TL of a simple expansion chamber of length 6 in (15.2 cm) expansion ratio m = 36. Figure 10.49 shows the result for two expansion chambers each 6 in (15.2 cm) long coupled together by a 4 in (10.16 cm) long tube.
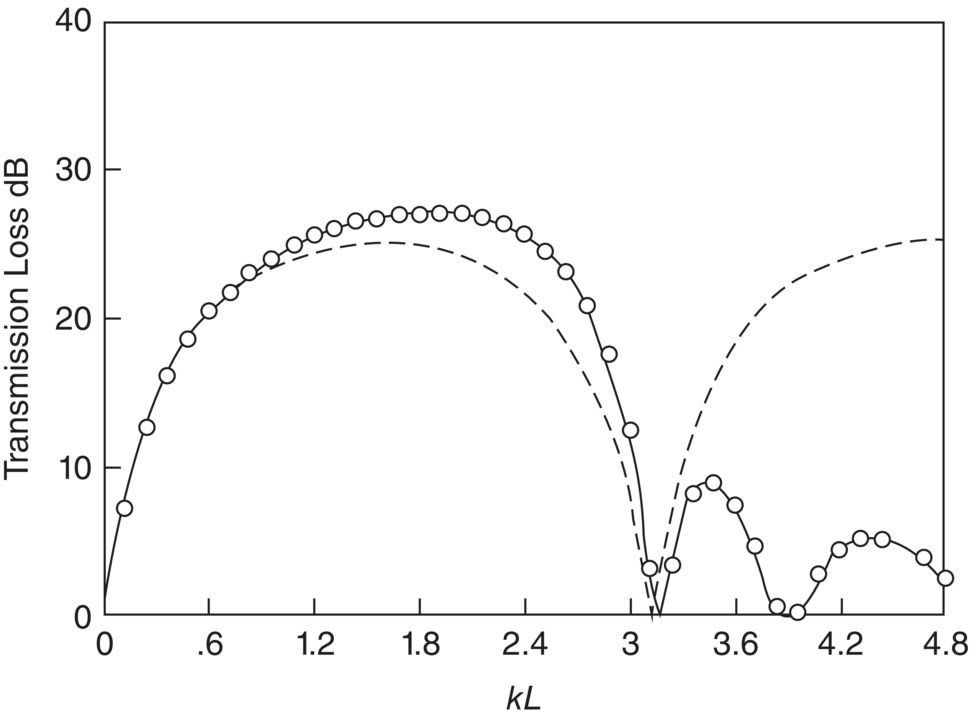
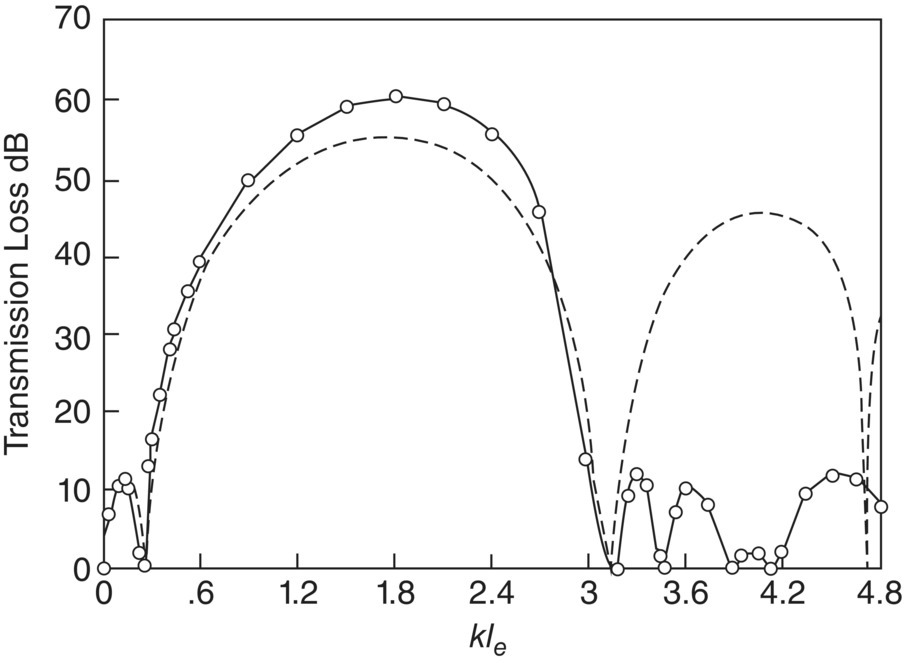
It is seen that the plane wave solution is adequate at frequencies of kle less than about 0.6. But above that value of kle, the plane wave theory fails because higher modes can exist in the expansion chamber(s) as well as plane waves. The authors also show how the four‐pole parameters, A, B, C, and D can be evaluated using two different boundary conditions in the BEM solution at the pipe system exit. In the first, the volume velocity is set to zero. In the second, the pressure is set to zero.
Wang, Tse, and Chen presented a detailed study using BEM to determine the TL of concentric perforated tube resonators [84]. They calculated the TL of a long and a short resonator with the same dimensions as these reported by Sullivan and Crocker [53]. Using the same porosity values and formula for the acoustic impedance used in Ref. [53] they were able to make predictions to compare with the experimental results of Sullivan and Crocker. The agreement is generally good, except for the inaccurate prediction of the first resonance peak of the short resonator [53]. They used their own set‐up to measure the TL of a variety of resonators without and with flow up to a Mach number of M = 0.15. As the authors point out, the BEM analysis is not restricted to acoustically long resonators and can include complex‐shaped boundaries.
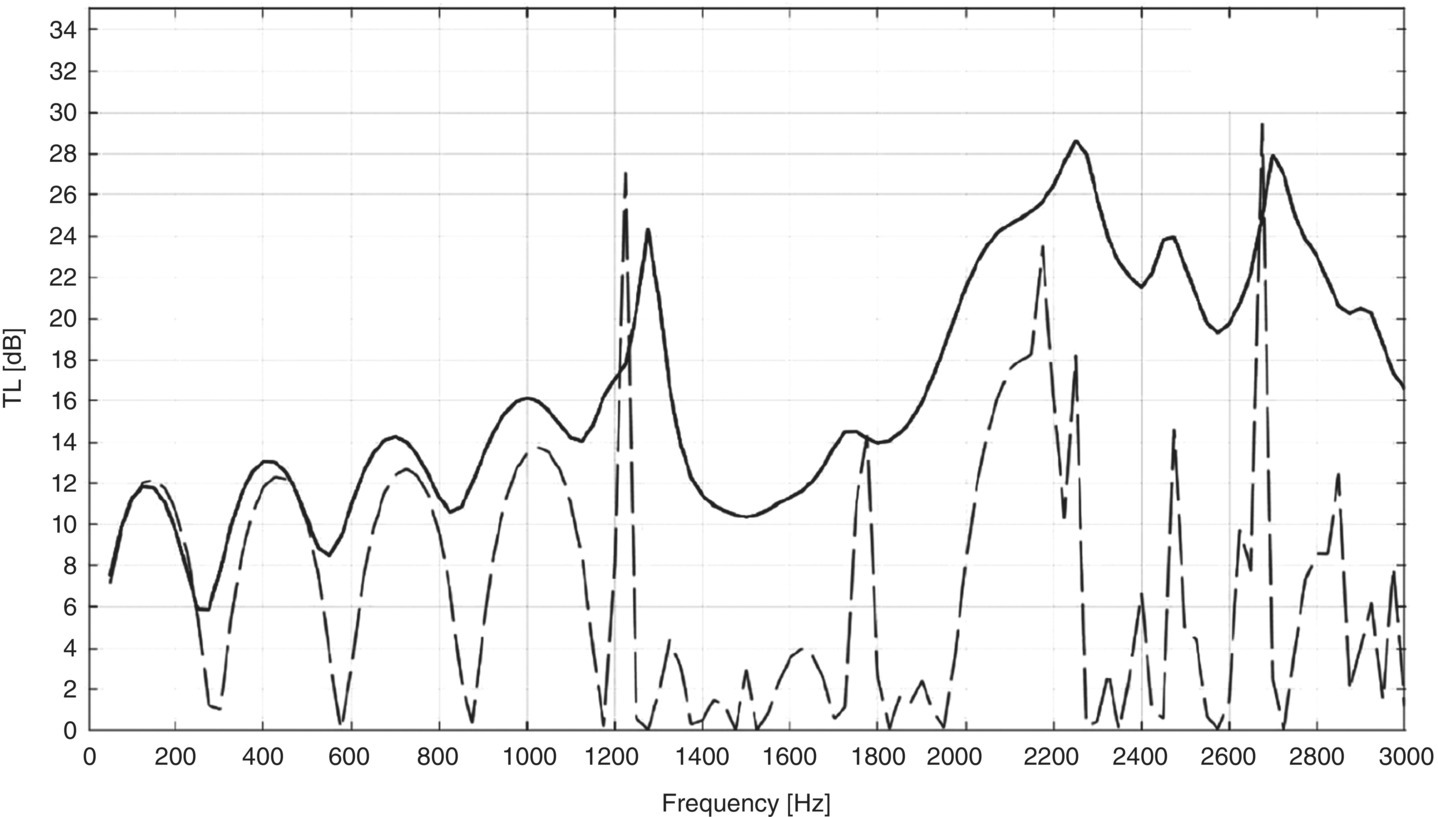
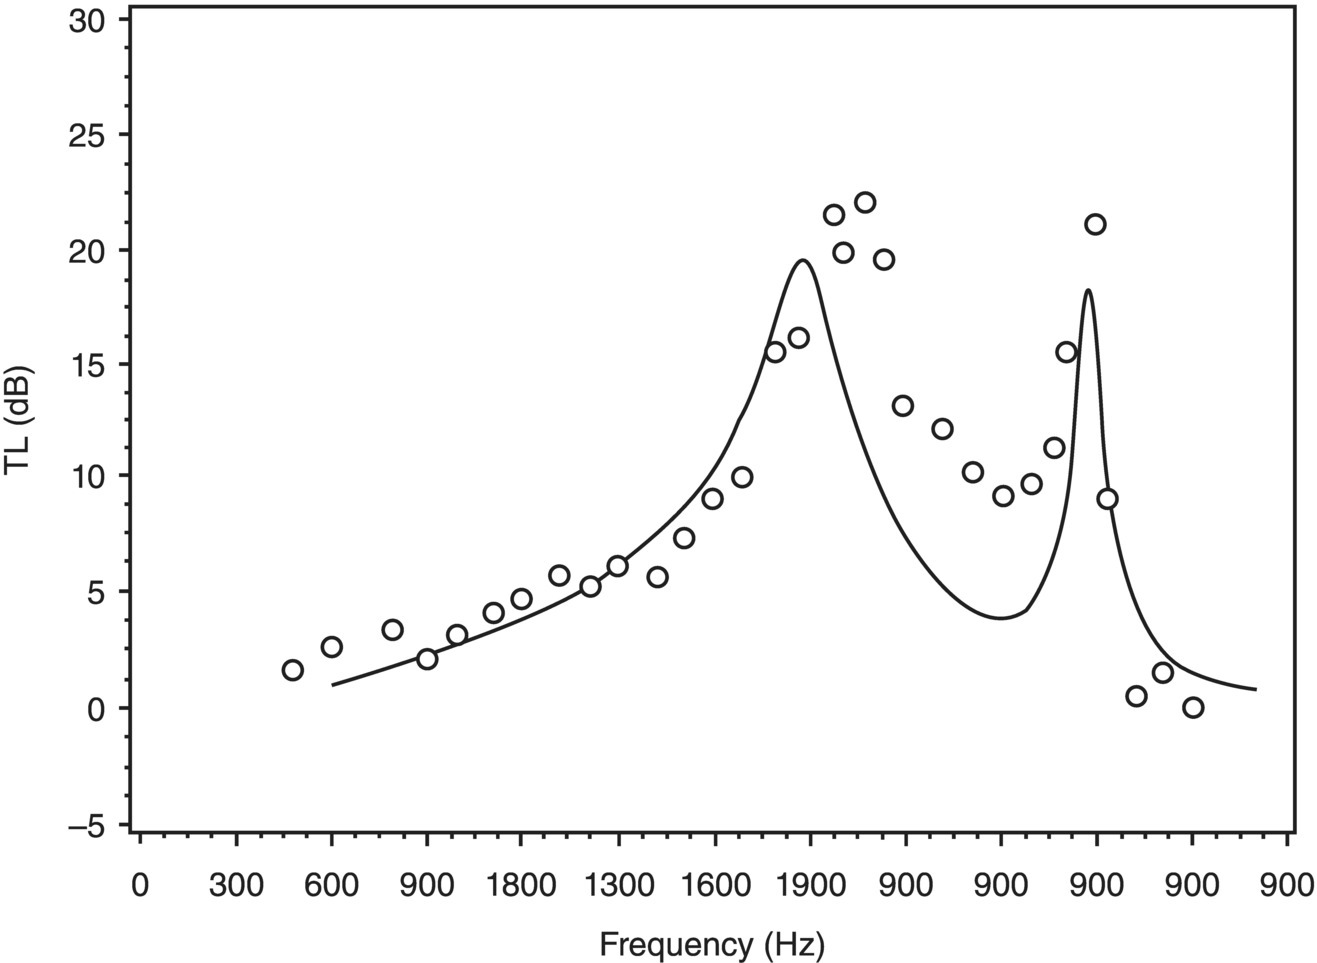
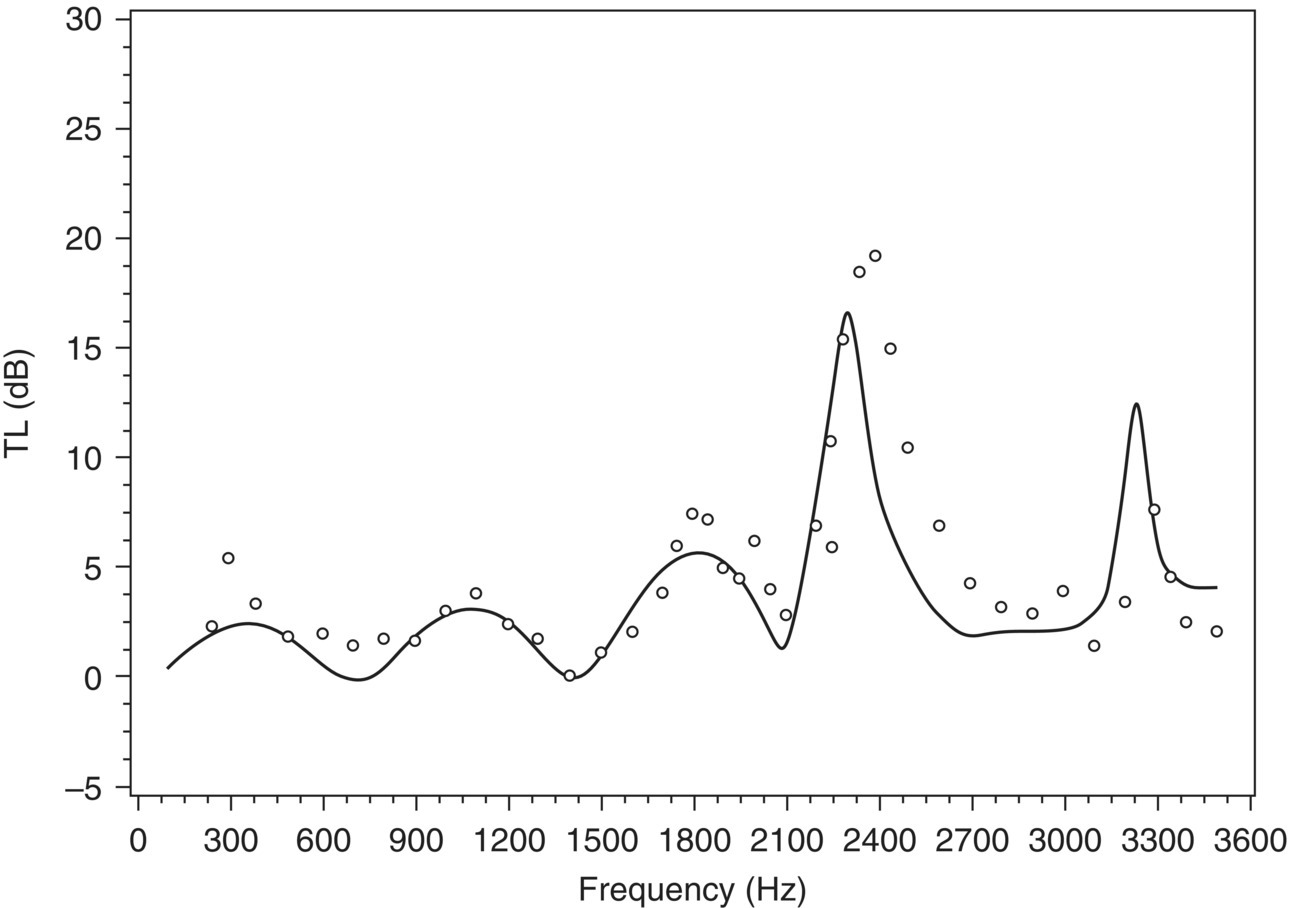
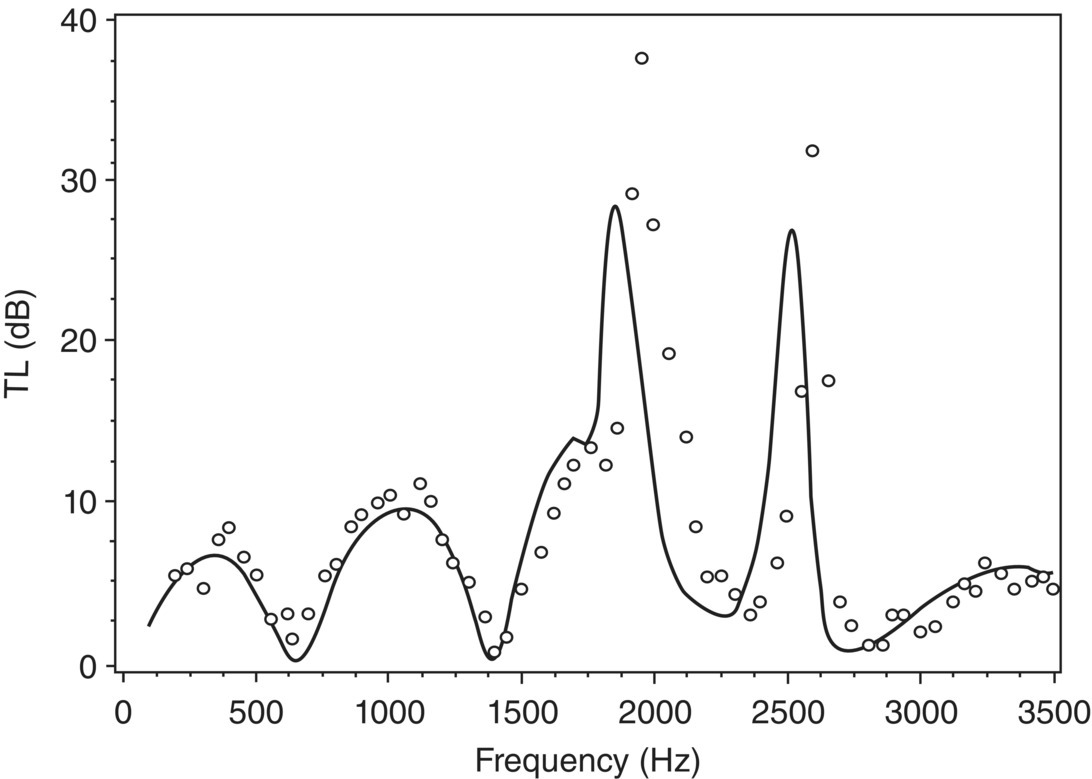
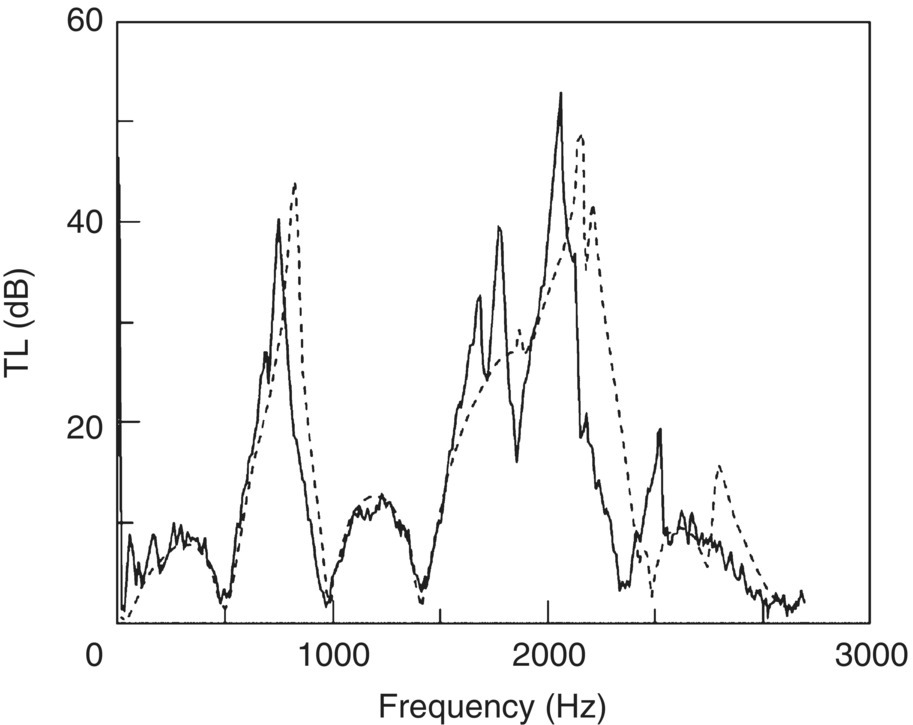
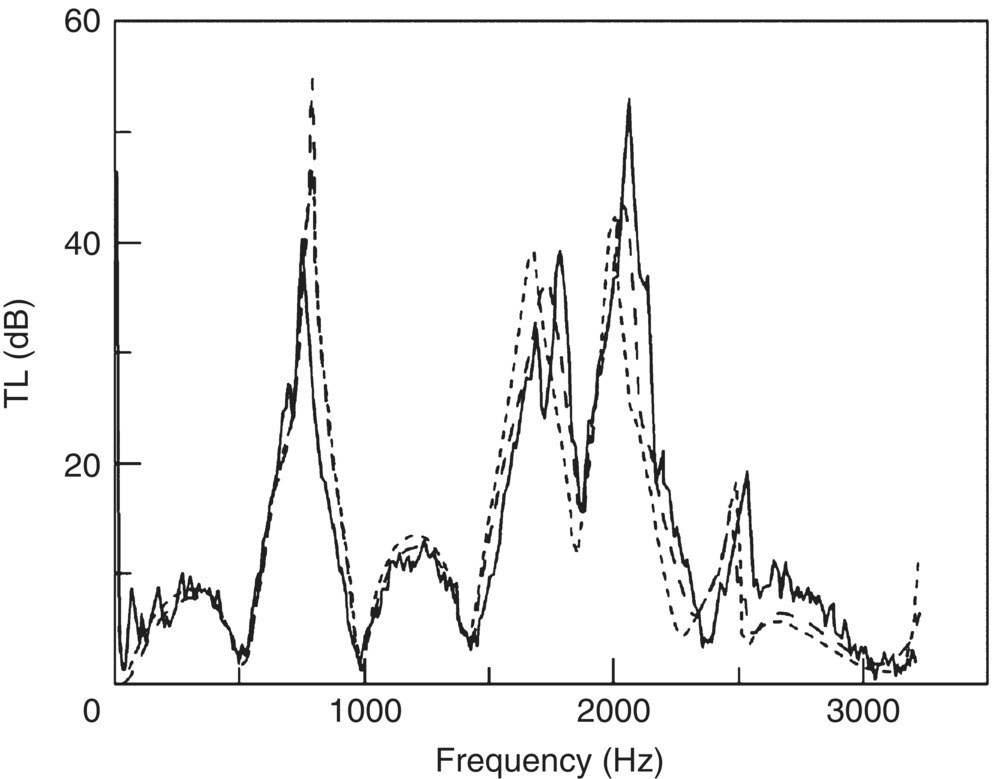
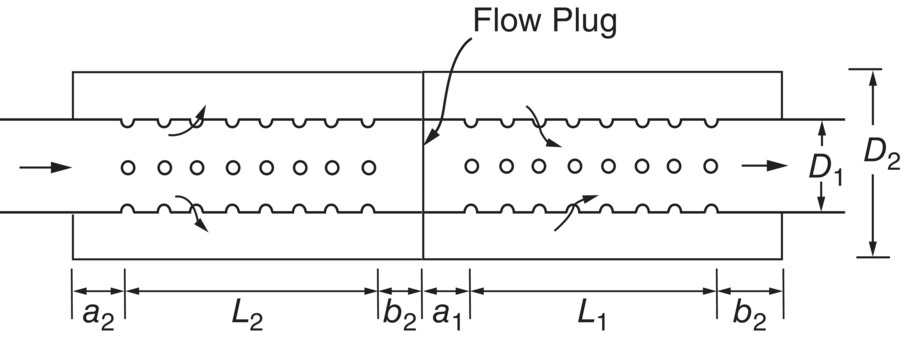
In 1996, Wu and Wan used a direct mixed‐body BEM together with a three‐point method to evaluate the TL of three concentric tube resonators [85]. They repeated the TL evaluations of the long and short resonators made by Wang, Tse, and Chen, but also examined a long concentric tube resonator with a flow plug. These resonators are exactly the same as the models examined by Sullivan and Crocker [53] and Sullivan [54, 55]. The results are shown in Figures 10.50–10.52. Their results are generally quite good, except for the first peak in the TL and the inaccurate prediction of the TL in the region between the two peaks in Figure 10.50.
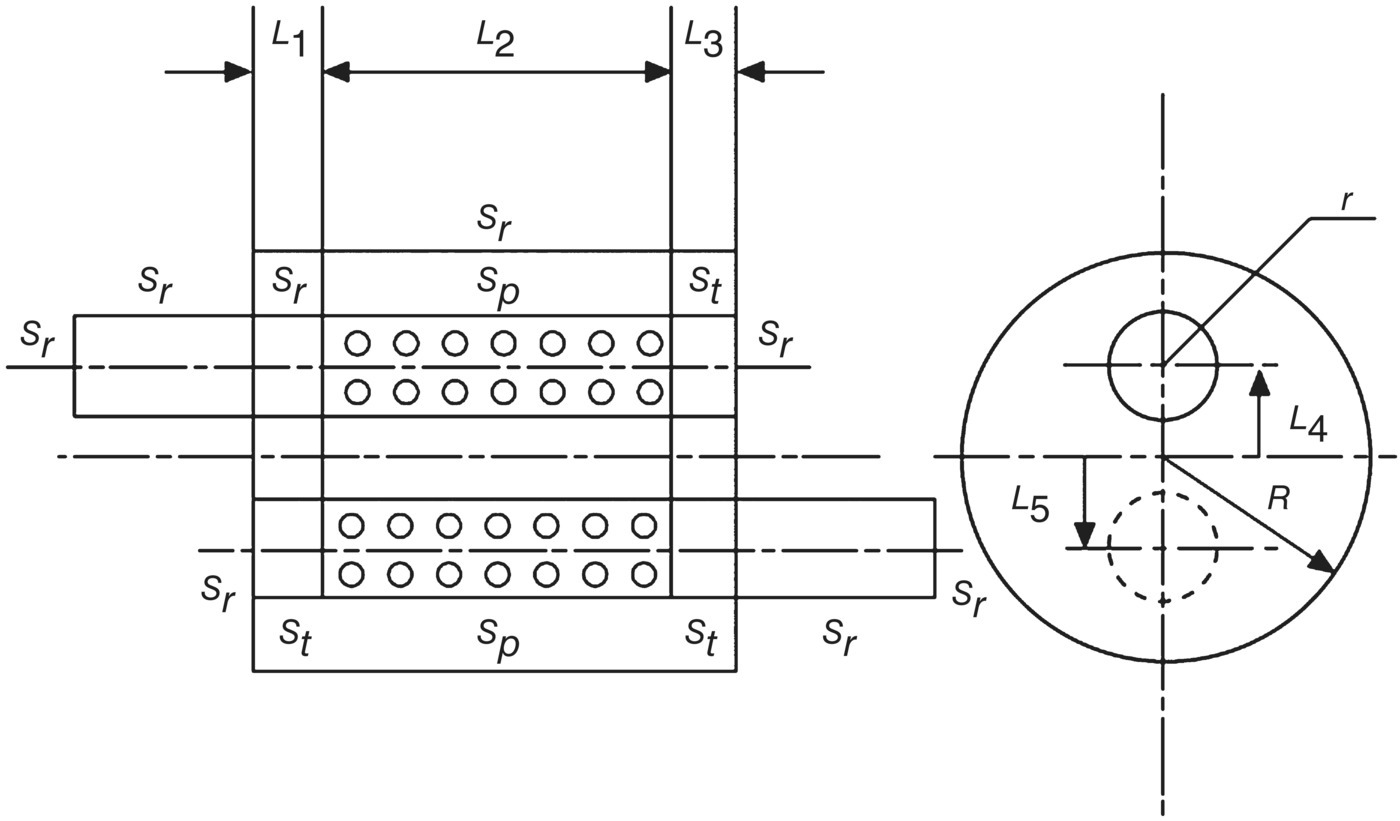
In 1998, Wu, Zhang, and Cheng used the BEM to improve the derivation of the four‐pole parameters [86]. Although their method still requires two BEM runs at each frequency, it is only necessary to solve the BEM matrix once at each frequency. Their improved method uses the velocity boundary condition at the system inlets and outlet. The authors present TL results for a concentric tube plug‐flow muffler and also one with two parallel perforated tubes. Wu, Zhang, and Cheng first present predictions for the TL of a concentric tube muffler with a flow plug inserted in the middle of the perforated tube (See Figure 10.53.) [86].
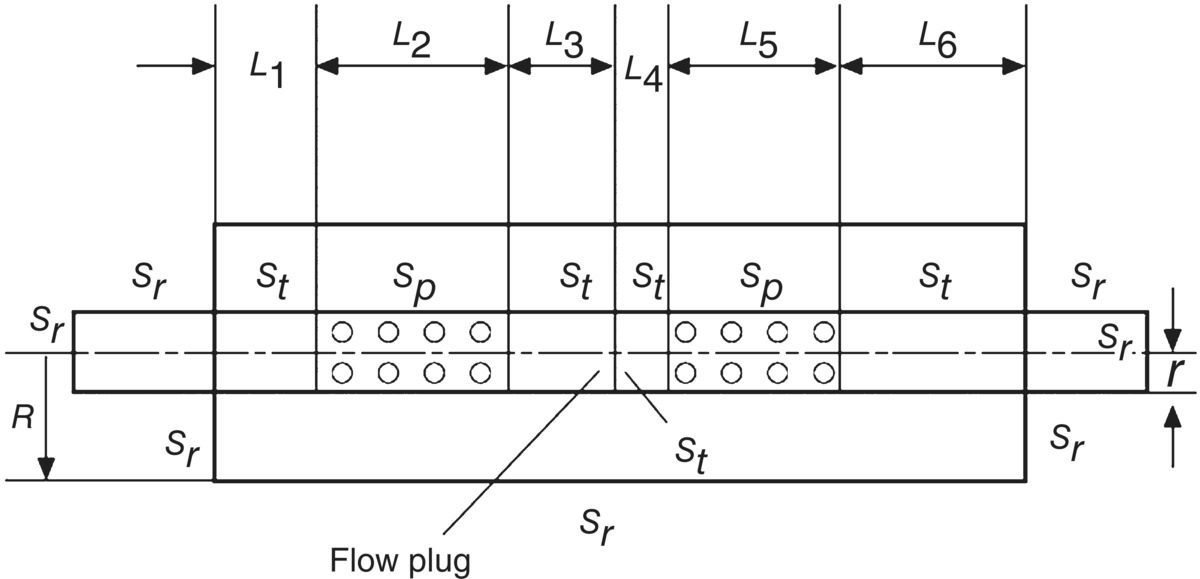
The geometry of the muffler is axisymmetric. The porosity in the first region is 21.68% and in the second region it is 13.54%. Figure 10.54 shows the TL predicted by the BEM (when Sullivan and Crocker’s impedance formula is used) compared with the experimental results of Wu et al.
Figures 10.54 and 10.55 show the TL results predicted when either the impedance formula of Sullivan and Bento Coelho are used.
In 2000, Wu edited a book on boundary elements, which included a CD‐ROM providing FORTRAN codes [88]. He authored Chapter 5 and included Figures 10.53 and 10.54 in this chapter. This example of a perforated muffler design along with its experimental results were used later by Gunda [79].
The TL predictions for the muffler with two parallel tubes (see Figure 10.56) were made first using Sullivan and Crocker’s formula for the perforate transfer impedance (see Figure 10.57a) and then also with an impedance formula proposed by Bento Coelho [87]. See Figure 10.57b.
It is seen in Figure 10.57b that Bento Coelho’s impedance formula gives some improvement in the TL prediction in the region of the large peak at 1800 Hz.
Gunda proposed an analysis method that uses BEM and a Fast Multiple Method (FMM). The FMM speeds up solution times considerably. However, most users still prefer FEM [79]. The analysis is performed using a commercial code formulation called Coustyx developed by ANSOL. This BEM/FMM approach reduces the number of nodes required by BEM allowing more complicated models to be solved at higher frequencies. Figure 10.58 shows the TL prediction for the perforated plug‐flow muffler made using the Coustyx code compared with experimental results from Wu [88].
Although in the low frequency region, Gunda’s BEM predictions seem to be as good as those of Wu. Also, in the mid‐ and high‐frequency ranges they are no better.
Recent developments have included extending the BEM approach to include mean flow [89]. Yang, Ji, and Wu have discussed the use of the BEM in conjunction with a point collocation approach to reduce the number of degrees of freedom [90]. Wu and Wang use a mixed‐body approach to evaluate TL using BEM and a three‐point method [85]. Hua et al. have explained that different methods can be used such as multiple acoustical loads and different sources to simplify TL determinations [91]. Wu, Zhang, and Cheng have described an improved method for deriving the four‐pole parameters using BEM [86]. Banerjee and Jacobi use a method based on Green’s Functions to predict TL [92]. Although, most modeling approaches assume that acoustical models are adequate in automobile muffler design, some researchers continue to use fluid mechanics and computational fluid dynamic (CFD) approaches [93–95]. Others have considered nonlinear effects as is also discussed in Section 10.12 [96].
10.9.3 TL of Concentric Tube Resonators
Although Davis et al. examined concentric tube resonators, their studies were not extended to the case where the center tubes have multiple perforations (or louvers) along their entire lengths. These are known in the automobile industry as “spit chambers” or “bean cans.”
Sullivan and Crocker have examined the TL of such concentric tube resonators. (See Figure 10.3.) These resonators, which are often used to provide broad added attenuation in the high‐frequency range, are constructed by placing a rigid cylindrical shell around a length of the perforated tube, thus forming an unpartitioned cavity. Sullivan and Crocker used a one‐dimensional control volume approach to derive a theoretical model which accounted for the longitudinal wave motion in the cavity and the coupling between the cavity and the tube via the impedance of the perforate [52, 53].
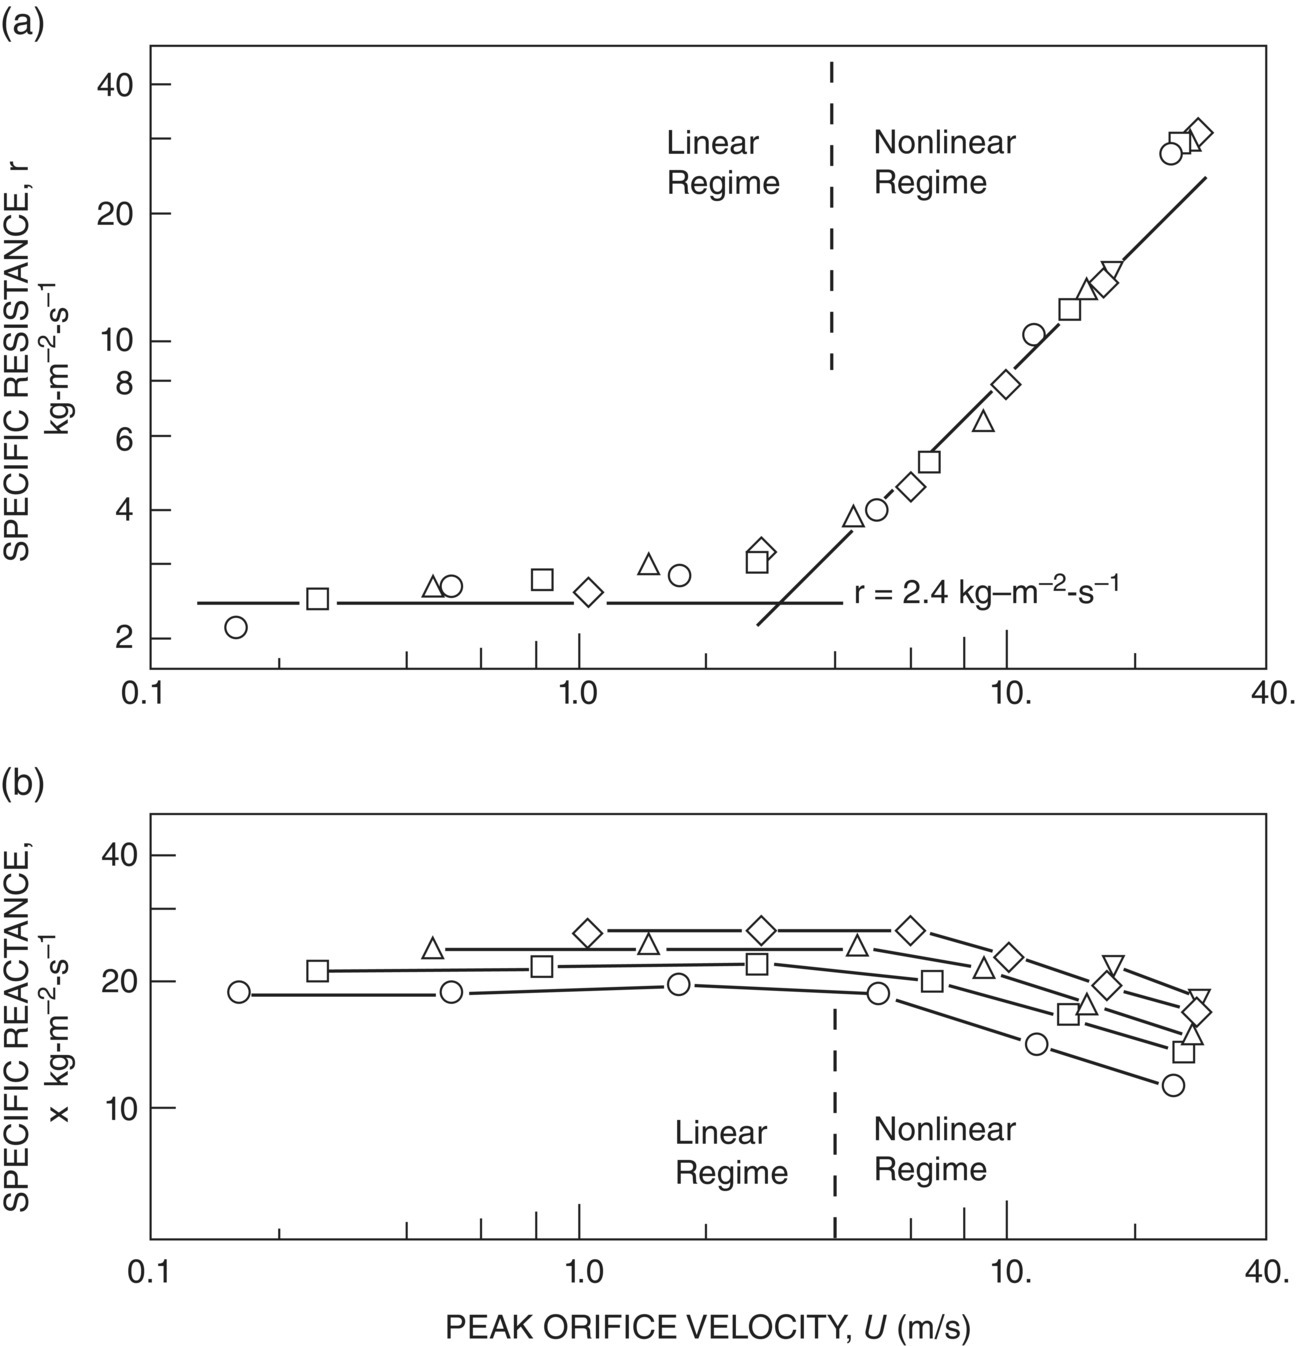
The impedance of the perforate needed for the computer program to predict the TL was obtained by measurement [53]. The instrumentation used is shown in Figure 10.59. The perforate sample was mounted flush with the face of a small anular cavity and the sound pressures at both the face and at the back of the cavity were measured simultaneously. Figure 10.60 presents an example of the specific resistance and reactance for a single orifice at room temperature without flow as a function of the peak orifice velocity. A linear behavior is observed in the resistance for SPLs in the 100–120 dB range and is largely independent of frequency. At levels between 120 and 150 dB, the behavior of both the resistance and reactance becomes nonlinear.
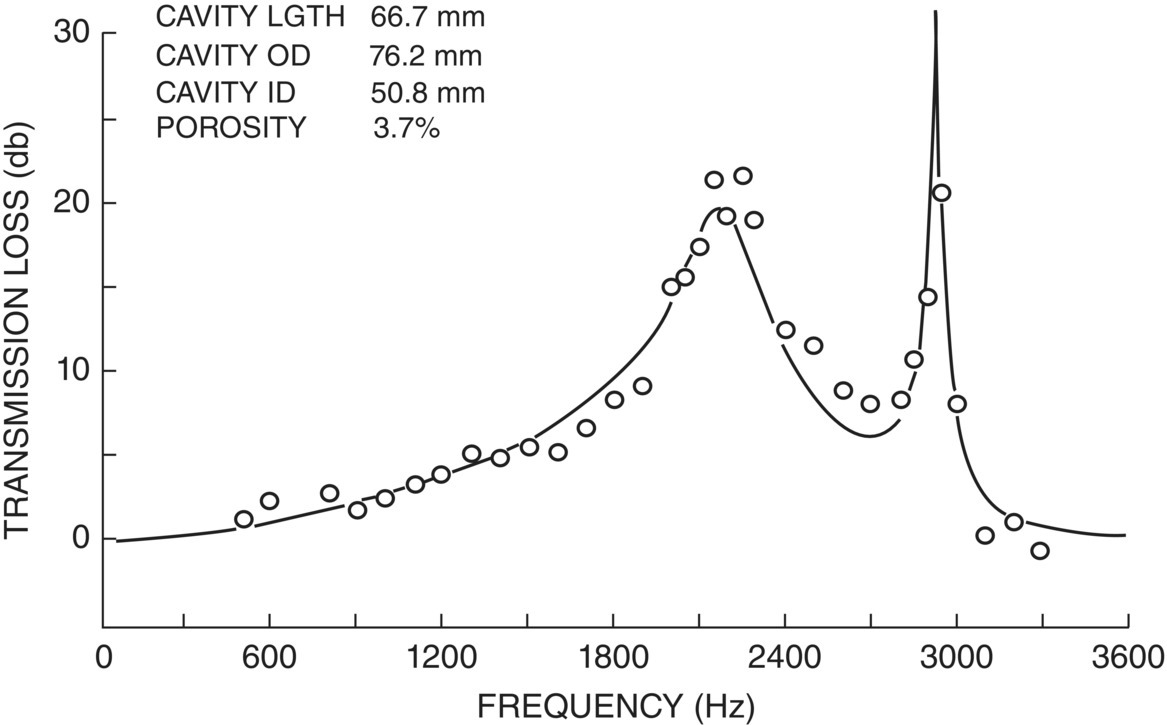
Figures 10.61 and 10.62 show the TL for both short and long resonators [52, 53]. In short resonators the primary resonance frequency fr is less than the first axial modal frequency fl of the cavity, (fl = c/2l) where c is the speed of sound and l the length. If fr > fl, then the cavity is said to be acoustically long. The TL of acoustically short resonators (Figure 10.61) is characterized by two peaks. The first resonance peak results from the coupling of the center tube with the concentric cavity and its frequency fr can be calculated approximately from the branch Helmholtz equation [52, 53]. However in Figure 10.61, the Helmholtz frequency f0 is less than the fundamental frequency fr by 27%. The frequency of the second peak in Figure 10.59 is related to but not equal to the first axial cavity modal frequency fl = c/2l.
The performance of concentric tube resonators is dependent on the parameter k0 l, where k0 = 2πf0/c = ![]() . Here k0 is the wave number of the Helmholtz resonance frequency f0, c is the speed of sound, and C, V, and l are the conductivity, volume and axial length of the resonator respectively.
. Here k0 is the wave number of the Helmholtz resonance frequency f0, c is the speed of sound, and C, V, and l are the conductivity, volume and axial length of the resonator respectively.
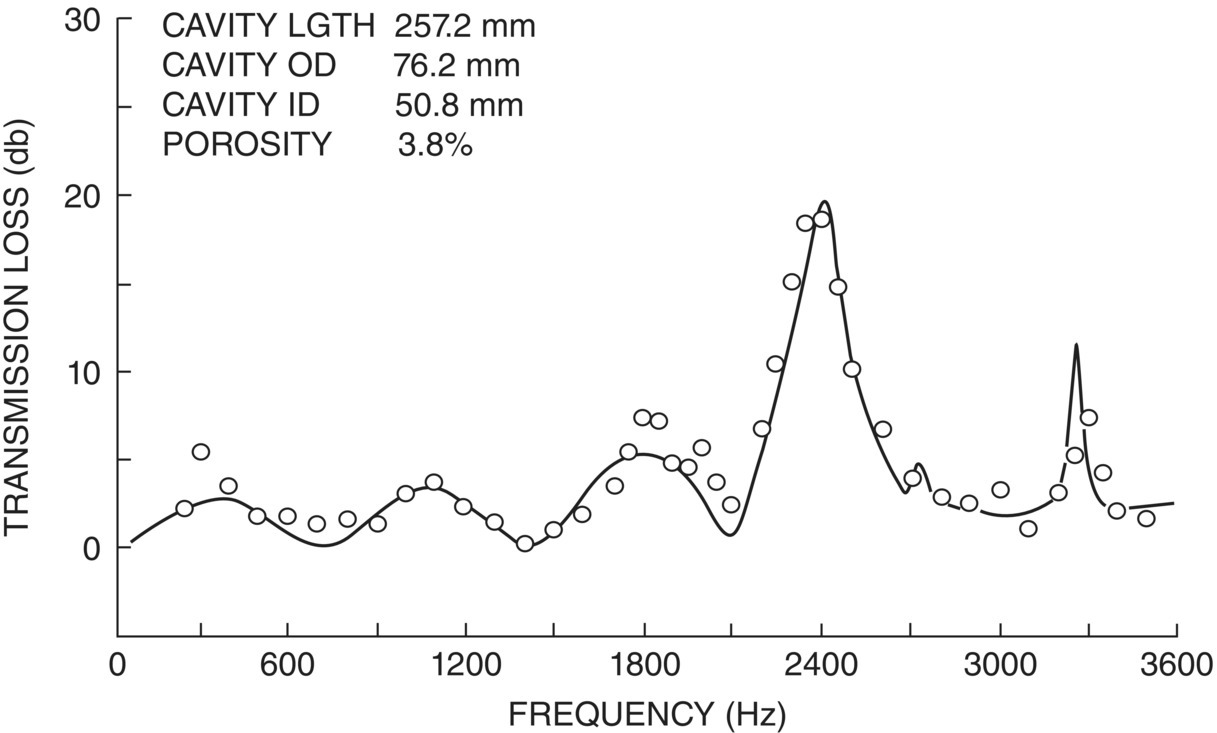
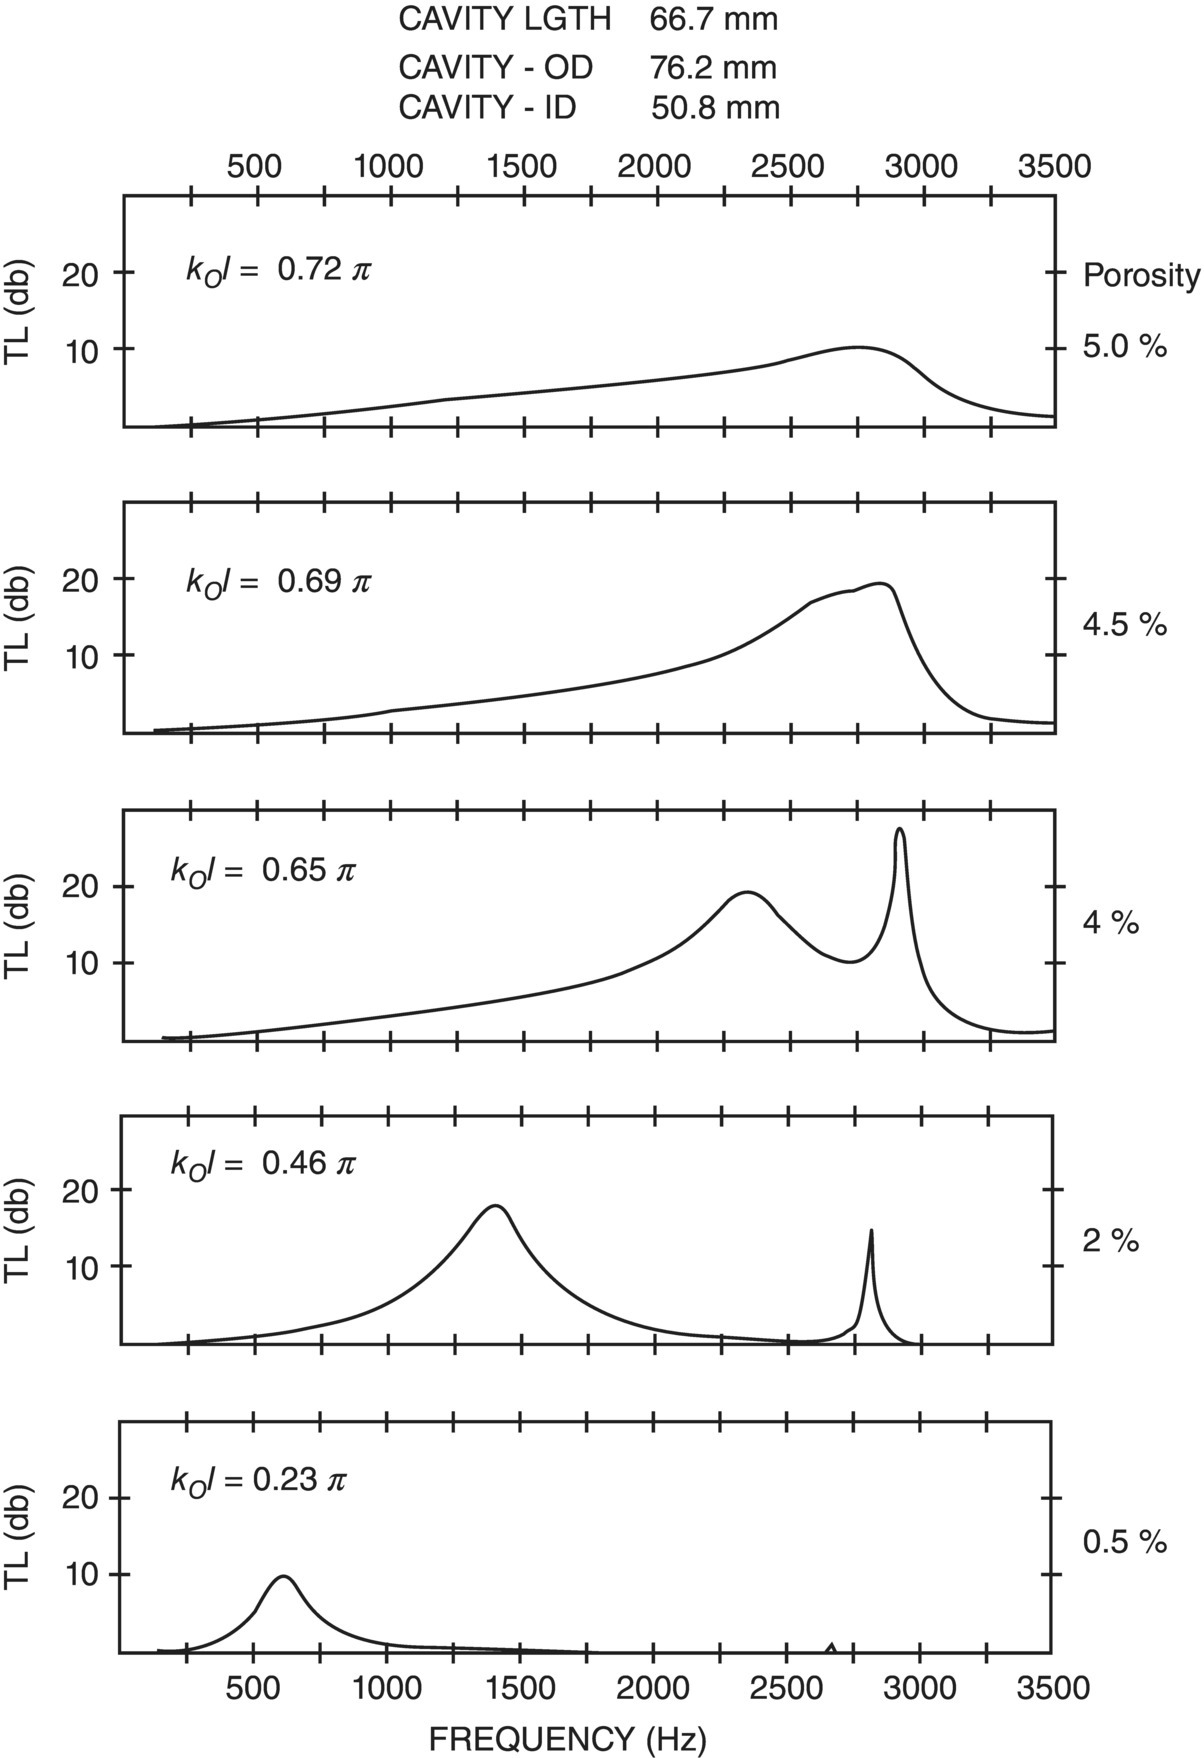
In Figure 10.62, the TL of an acoustically long resonator is shown. Here the primary resonance frequency fr occurs above the first and several other longitudinal standing wave mode frequencies in the cavity. Figure 10.63 shows the theoretical effect of changing the porosity of a resonator of constant length 66.7 mm so that as the porosity is increased from 0.5 to 5.0%, the primary resonance frequency fr and the first axial mode frequency f1 are gradually merged to provide a wide band of high TL [52, 53]..
Even before the studies were published by Davis et al. in 1954, it had become known that the porosity and length of concentric tube resonators was important. Ingard and Pridmore‐Brown showed the resonator length was important in 1951 [97]. In 1958, Igarashi and Toyama demonstrated the importance of porosity [23]. However neither of the 1951 and 1958 experimental studies included the effects of mean flow and finite amplitude exhaust noise. Although, Sullivan and Crocker’s 1978 paper demonstrated the importance of the length, these other effects were not included in that paper. Sullivan demonstrated these effects clearly in important papers published in 1979. In the 1978 study, mean flow can be included, but it is assumed that the whole louver pattern is uniform and that the impedance of the perforations is constant along its length.
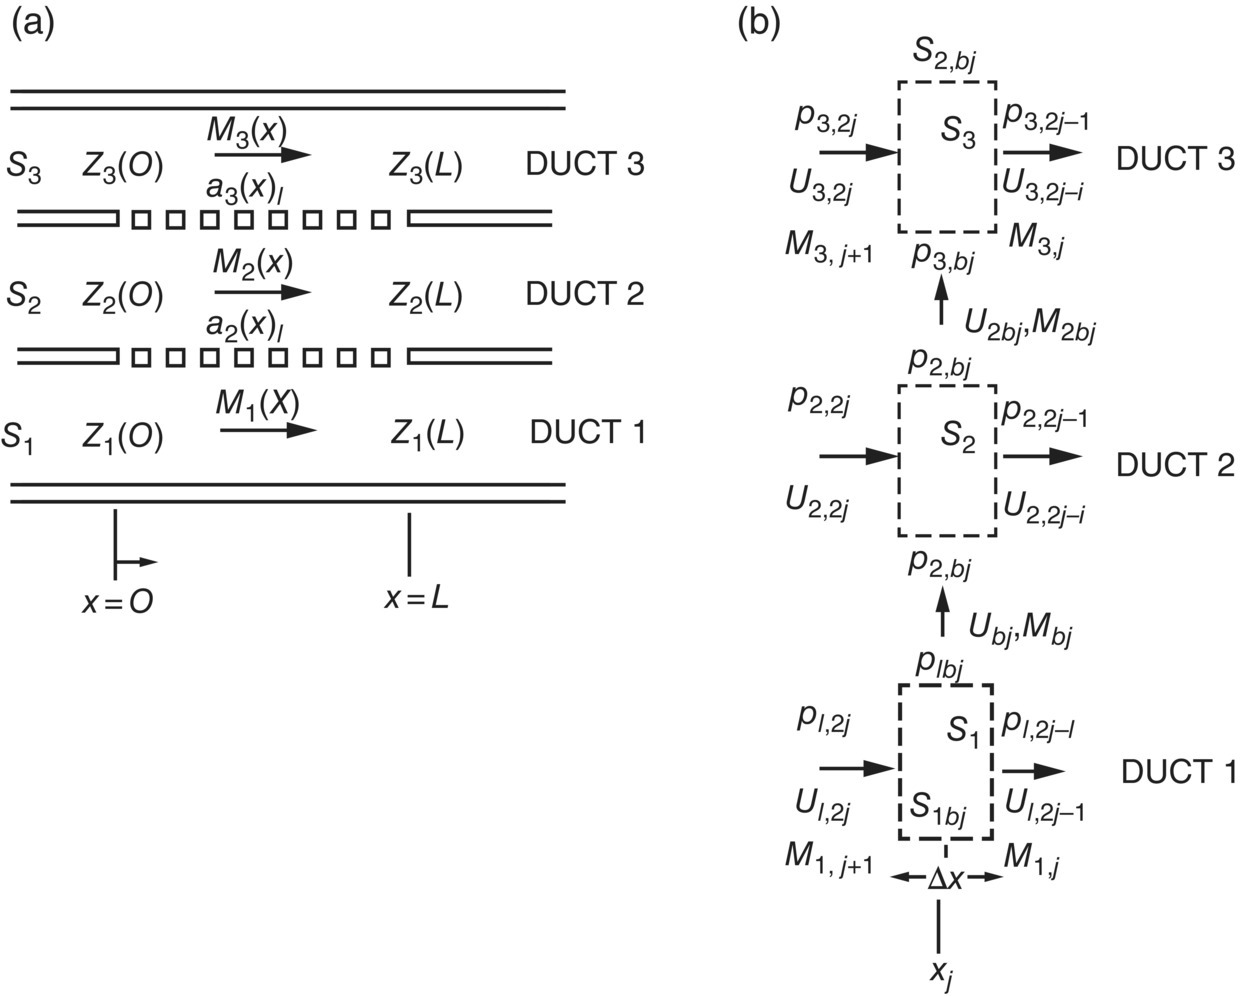
Sullivan continued his studies to consider mathematical modeling and experimental modeling of perforated two‐duct through flow, cross‐flow and reverse‐flow elements (Table 10.1). Subsequently he studied duct cross‐flow and reverse‐flow three‐duct systems (Table 10.2). The focus of his work was on such configurations that are acoustically long in the flow direction and short in the cross dimension. Davies et al. and Igavashi and Toyama [23] had studied the effect of porosity of perforated concentric tube elements experimentally. However, Sullivan was the first to provide theoretical models with experimental confirmation for such elements including mean flow and finite amplitude effects [52, 53].
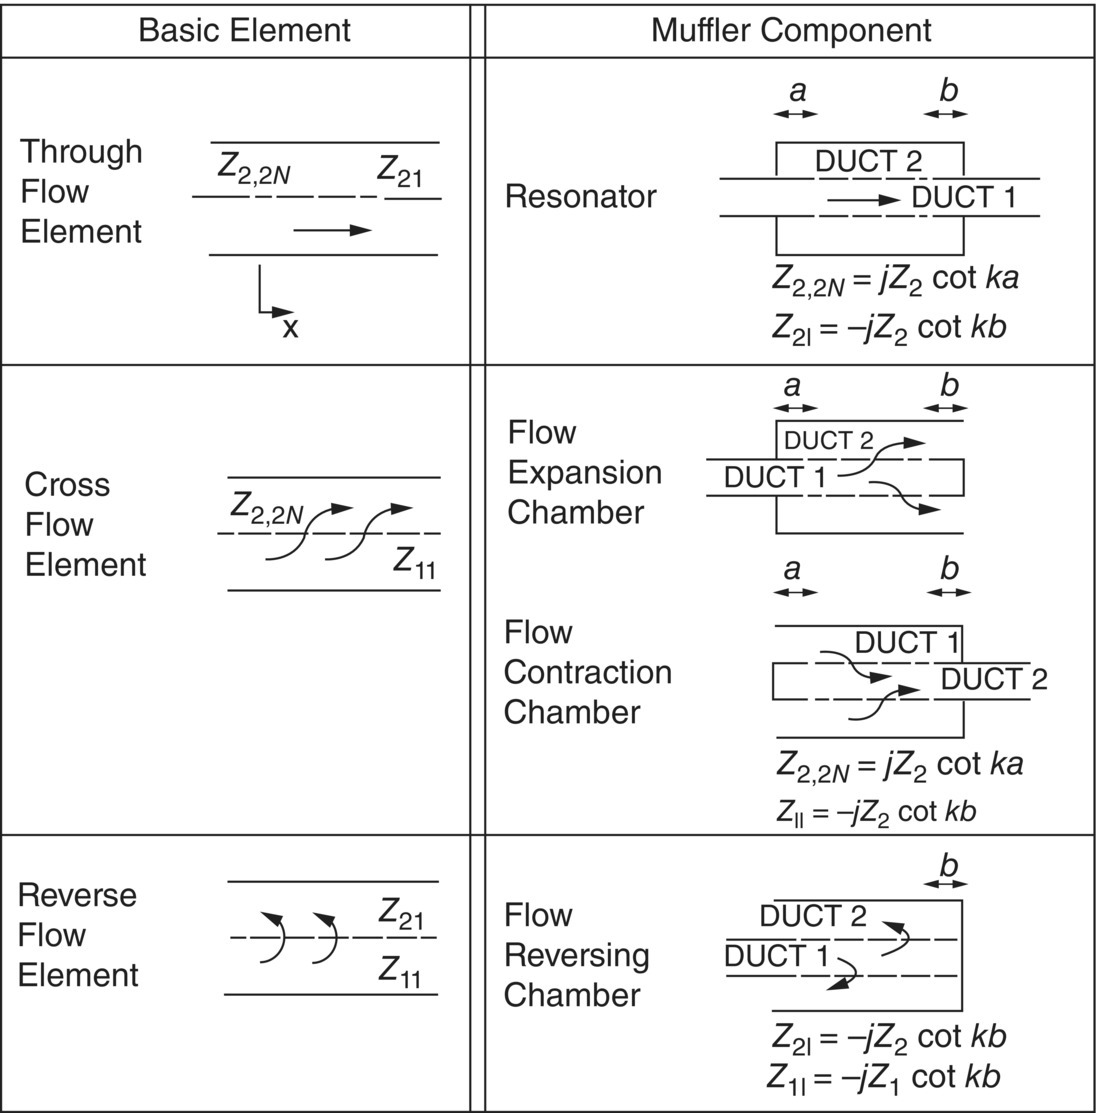
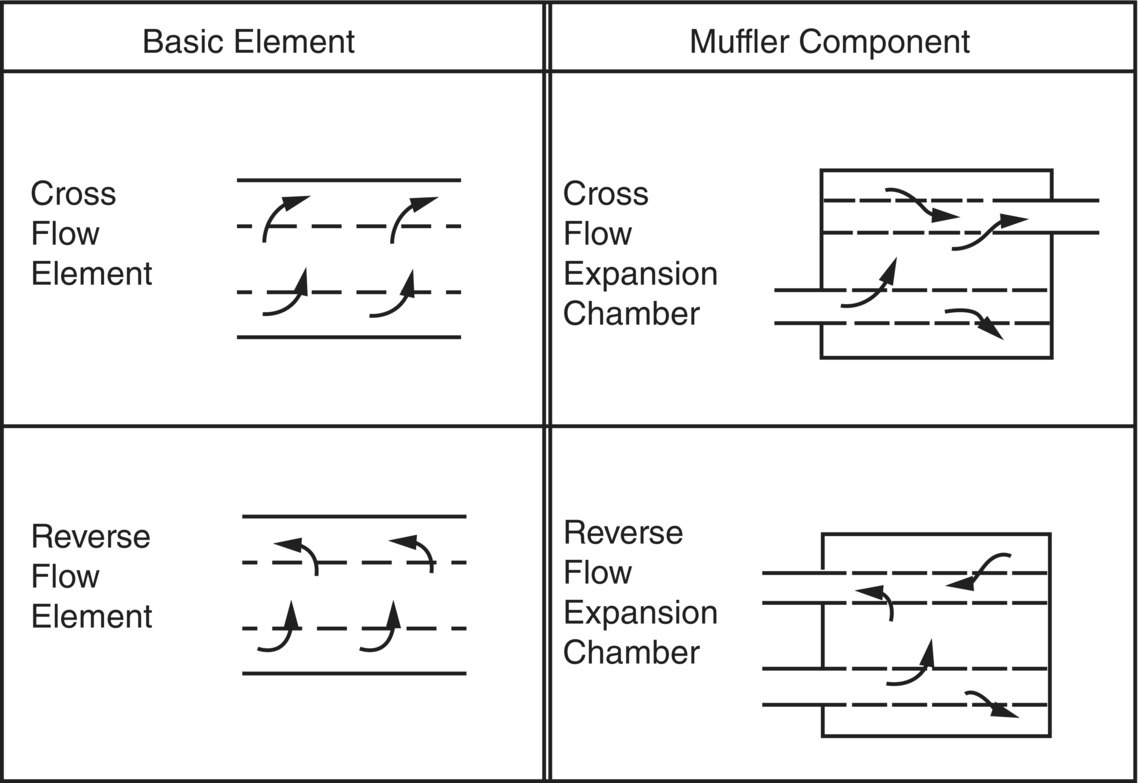
Figure 10.64 shows the resonator Sullivan studied. (See the top row of Table 10.1.) Using a segmentation approach, the resonator is divided into a number of elements; Figure 10.65a shows the basic two‐duct element; Figure 10.65b the branch point model of the perforate, and Figure 10.65c the control volume representation of the jth branch at which the acoustic properties are matched.
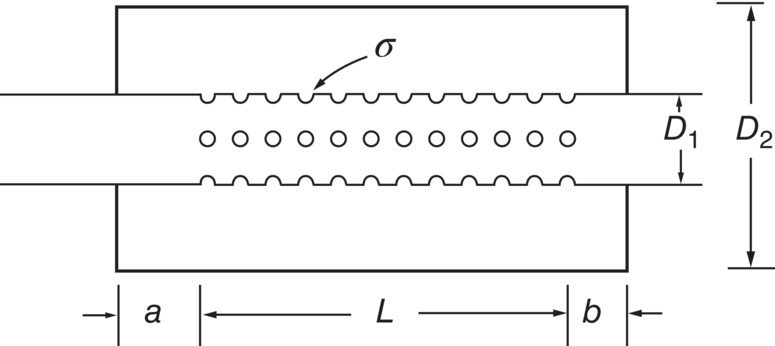
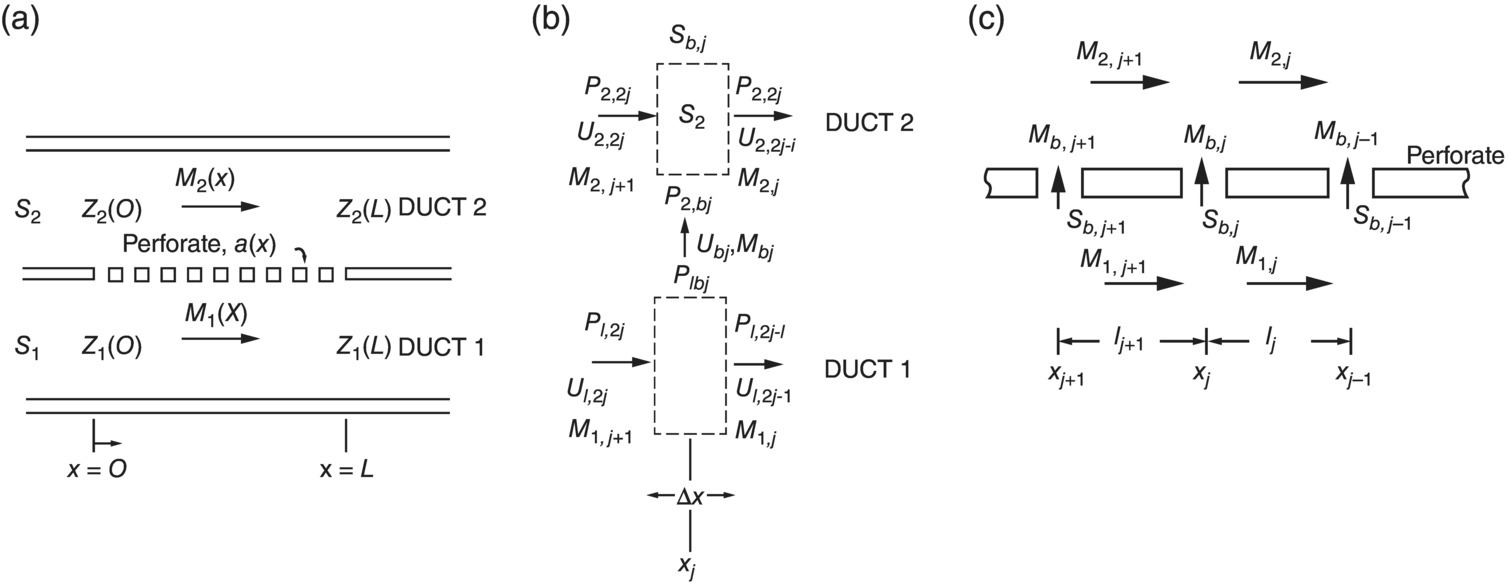
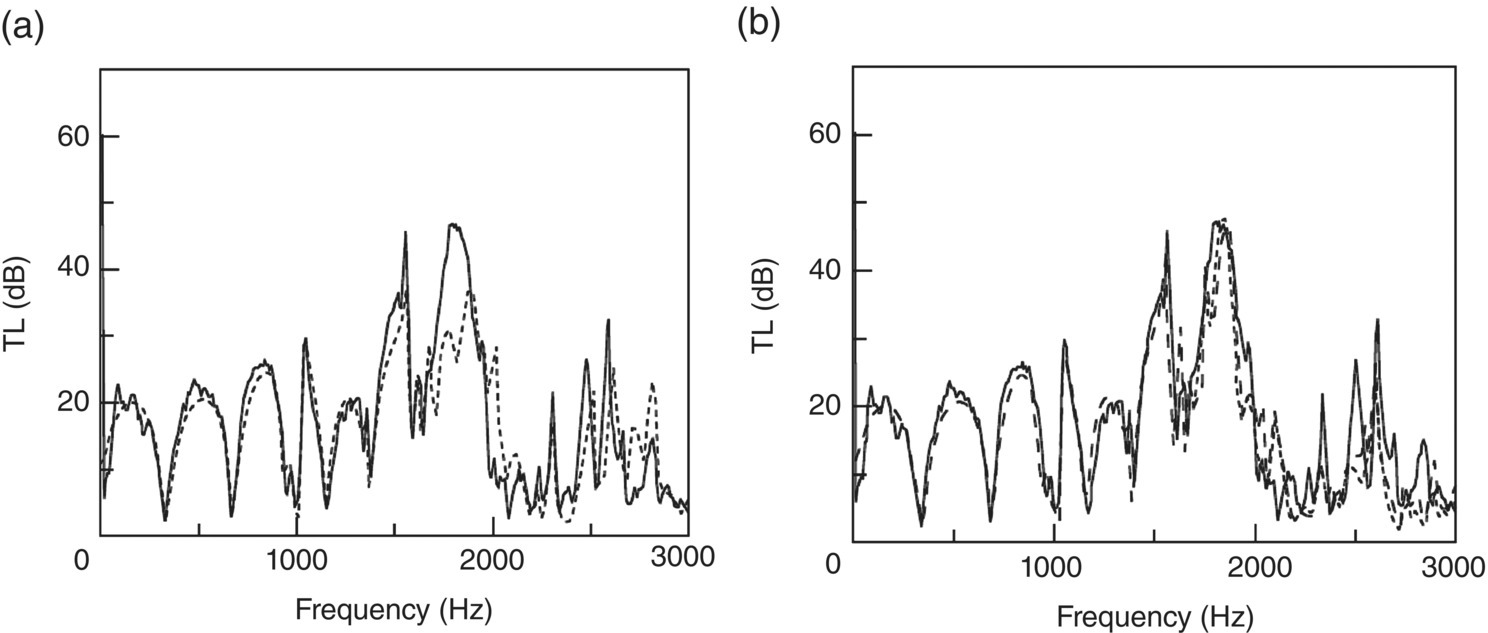
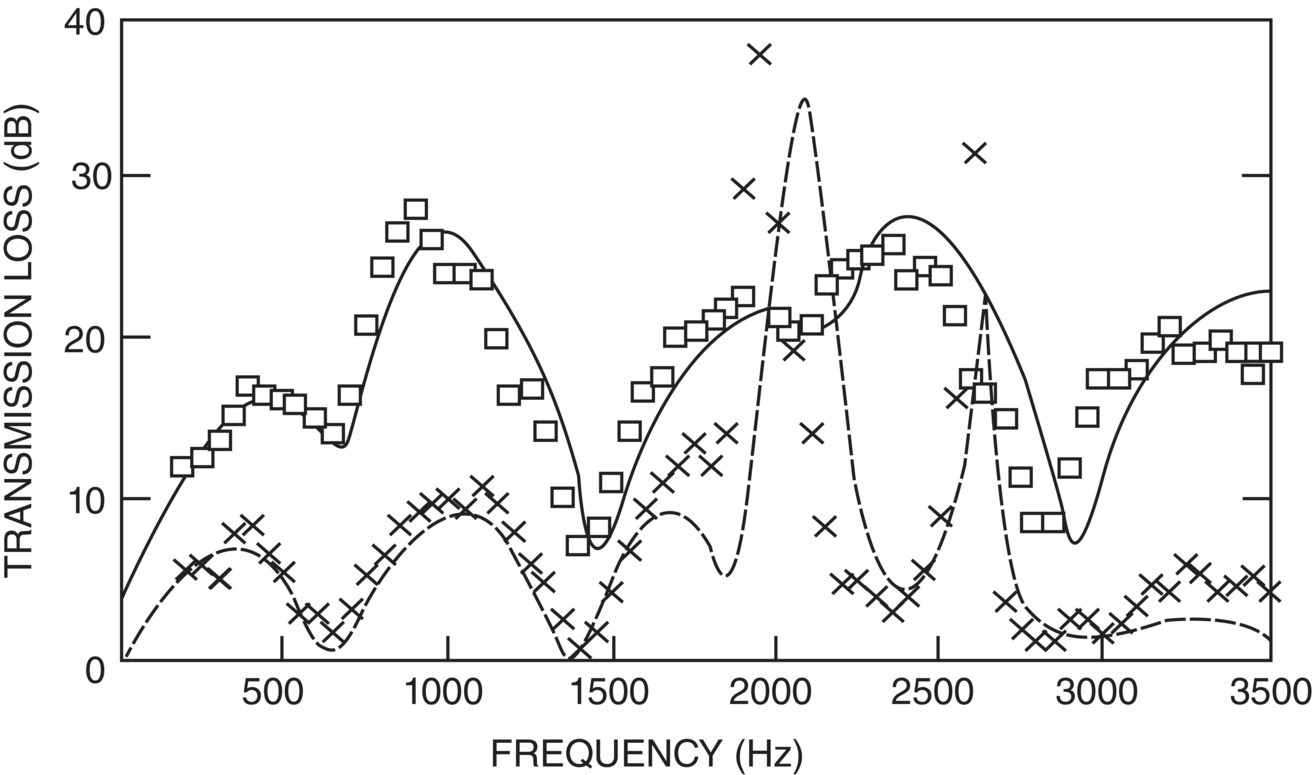
Figure 10.66 shows the TL of the resonator operating in the linear and nonlinear regimes. This clearly shows a 10 dB reduction in TL, which occurs in the nonlinear regime.
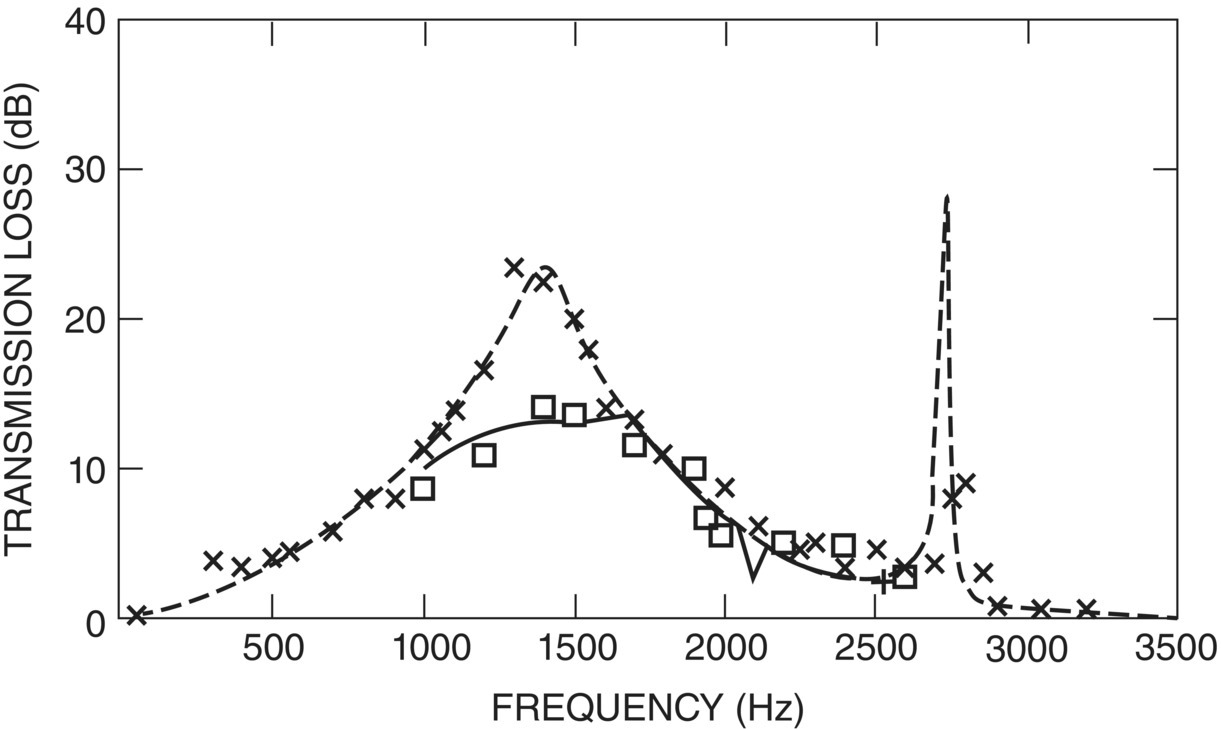
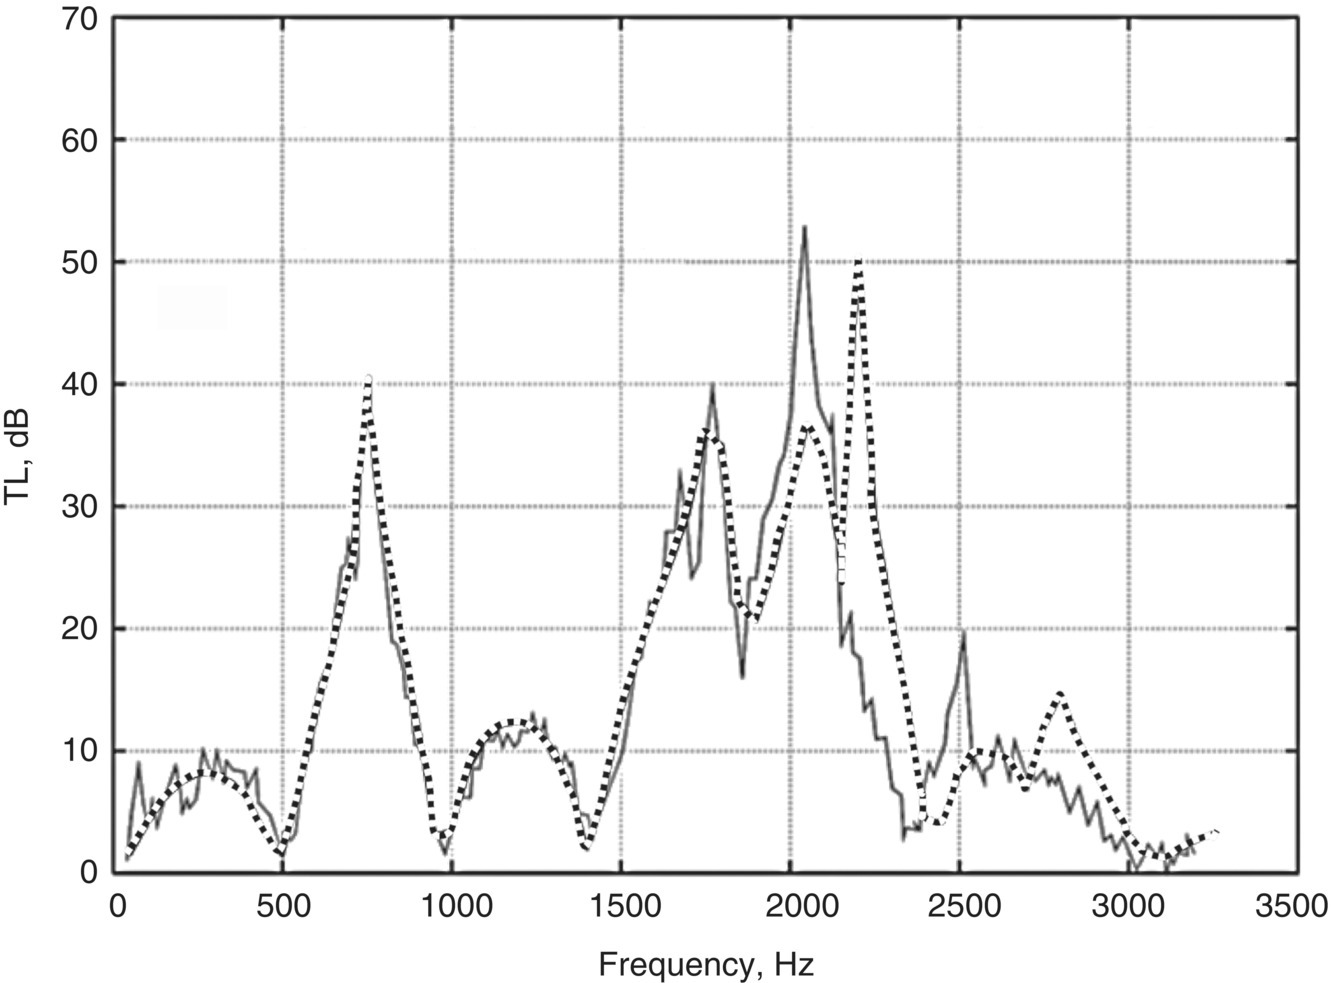
Figure 10.67 shows the cross‐flow chamber studied. Figure 10.68a shows the basic three‐duct element and Figure 10.68b the control volume representation of the jth branch. Figure 10.69 shows the effect of a mean flow of Mach number 0.05 on the TL. In this case, the peak TL at 2100 Hz is reduced by more than 10 dB and shifted to a higher frequency. However, the major effect is that the TL is increased by 10 dB or more over most of the frequency range.
Leave a Reply