Sometimes in acoustics and vibration we encounter signals which are pure tones (or very nearly so), e.g. the 120 Hz hum from an electric motor. In the case of a pure tone, the time history of the signal is simple harmonic and could be represented by the waveform x(t) = A sin (2πf1 t) in Figure 1.2a. The pure tone can be represented in the frequency domain by a spike of height A at frequency f1, Hz (see Figure 1.2a).
More often, sound signals are encountered which are periodic, but not simple harmonic. These are known as complex tones. Such sound signals are produced by most musical instruments (both wind and string). They can also be produced mechanically or electronically (a square wave is an example of a periodic signal or complex tone). The broken line plotted in Figure 1.2b is an example of a complex tone which is made up by the superposition (addition) of two simple harmonic signals, x(t) = A sin (2πf1 t) + B sin (2πf3 t). Note in this case we have chosen f3 = 3f1. The signal A sin (2πf1 t) is known as the fundamental (or first harmonic) and B sin (2πf3 t) is the third harmonic. In this particular case the second harmonic and the fourth and higher harmonics are completely absent from the complex tone x(t). The frequency domain representation of the complex tone is also given in Figure 1.2b.
In fact, Fourier [11] showed in 1822 that any periodic signal may be analyzed as a combination of sinusoids:
(1.1)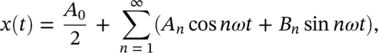
or in complex notation:
(1.2)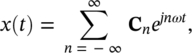
where ω = 2πf; f is the fundamental frequency; T = 1/f = 2π/ω, is the period of the signal; j = ![]() , and An and Bn are the Fourier coefficients calculated from [4, 6, 8]
, and An and Bn are the Fourier coefficients calculated from [4, 6, 8]
(1.3a)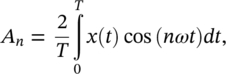
(1.3b)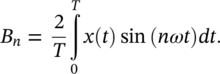
The sine and cosine terms in Eq. (1.1) can have values of the subscript n equal to 1, 2, 3, …, ∞. Hence, the signal x(t) will be made up of a fundamental frequency ω and multiples, 2, 3, 4, …, ∞ times greater. The A0/2 term represents the D.C. (direct current) component (if present). The nth term of the Fourier series is called the nth harmonic of x(t). The amplitude of the nth harmonic is
(1.4)![]()
and its square, ![]() , is sometimes called energy of the nth harmonic. Thus, the graph of the sequence
, is sometimes called energy of the nth harmonic. Thus, the graph of the sequence ![]() is called the energy spectrum of x(t) and shows the amplitudes of the harmonics.
is called the energy spectrum of x(t) and shows the amplitudes of the harmonics.
EXAMPLE 1.1
Buzz‐saw noise is commonly generated by supersonic fans in modern turbofan aircraft engines. A buzzing sound can be represented by the periodic signal shown in Figure 1.3. Find the Fourier series and the energy spectrum for this signal.
SOLUTION
We are required to represent x(t) = At over the interval 0 ≤ t ≤ 1, T = 1, and the fundamental frequency is ω = 2π/T = 2π. Then, we determine the corresponding Fourier coefficients using Eqs. (1.3a) and (1.3b)
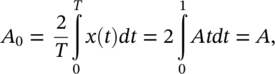

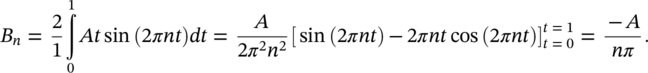
Therefore, substituting for the Fourier coefficients in Eq. (1.1) we get
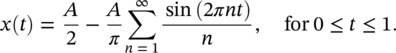
The energy spectrum of x(t) is shown in Figure 1.4. For this case the frequency spectrum is discrete, described by the Fourier coefficients (Eq. (1.4)). Note that for a Fourier series with only sine terms, as in Example 1.1, the amplitude of the nth harmonic is Cn = |Bn|. The energy spectrum has spikes at multiples of the fundamental frequency (harmonics) with a height equal to the value of ![]() . Thus, the spectrum is a series of spikes at the frequencies ω = 2πf, and overtones 2ω = 2 × 2πf, 3ω = 3 × 2πf, … with amplitudes (A/π)2, (A/2π)2, (A/3π)2, … respectively.
. Thus, the spectrum is a series of spikes at the frequencies ω = 2πf, and overtones 2ω = 2 × 2πf, 3ω = 3 × 2πf, … with amplitudes (A/π)2, (A/2π)2, (A/3π)2, … respectively.
Leave a Reply